
Weekly Market Review Oct 23-27th 2023 part 1 (Review of Crucial Technical level, Macro, Bearish, Bullish scenario planning )
Weekly Market Review Oct 23-27th 2023 part 1 (Review of Crucial Technical level, Macro, Bearish, Bullish scenario planning )

Stock indices are decidedly bearish this week with multiple distribution day and 4200 level in S&P 500 fell like knife through hot butter.
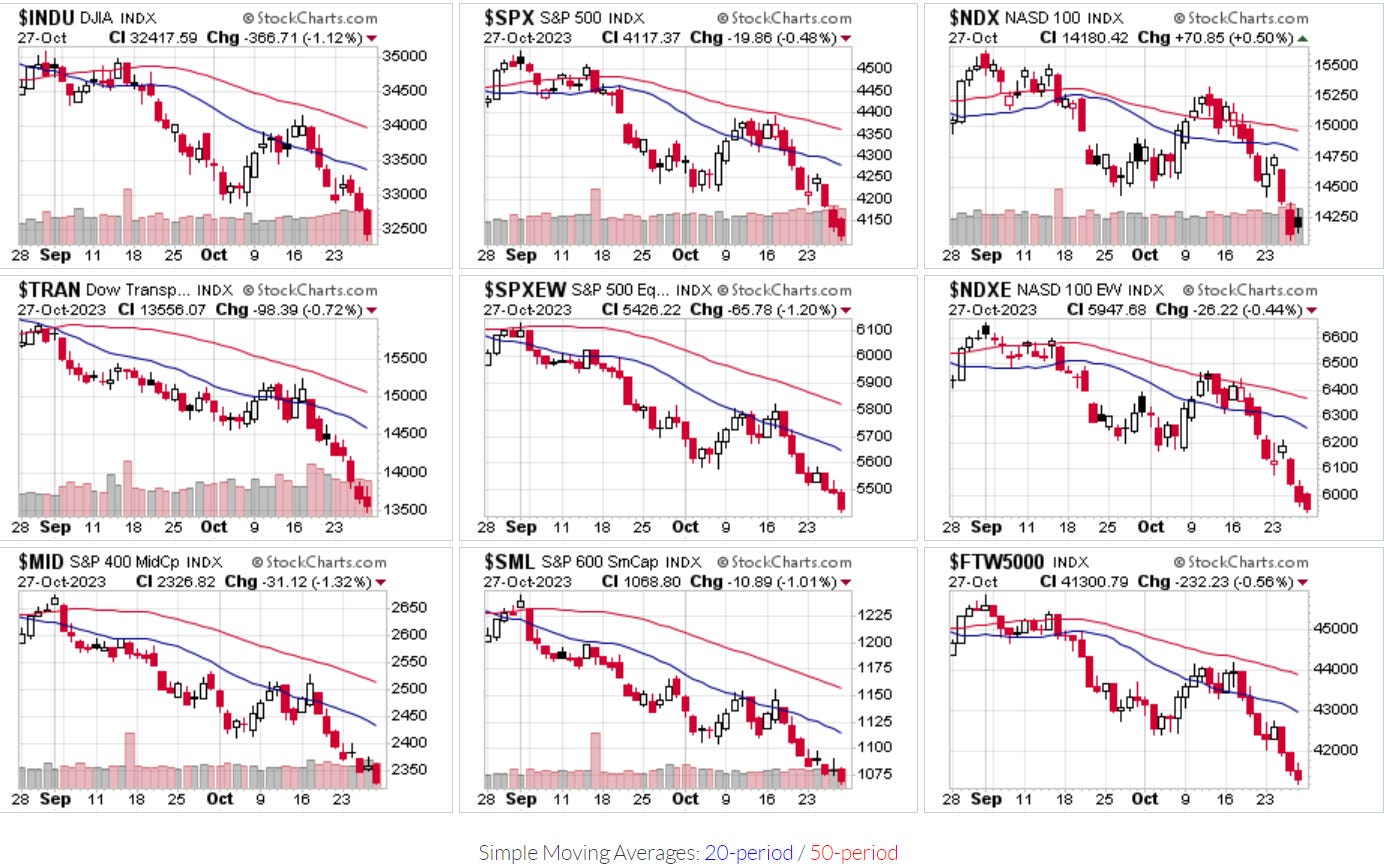
On Friday ,10Y yield hovered around 4.85% and DXY is still high, benchmark US stock indices sell off again( Nasdaq 100 rise 1.89%, S&P 500 drop 0.48%, DJIA fall 1.12% ) . Small & Mid cap fall by 1.01%, 1.32% respectively.
Weekly market review will be divided into 2 parts and published separately,
Part 1: Review of all crucial technical levels, Bearish/Bullish/Macro Scenario planning
Part 2: Breadth, various Sector, Bond charts review
Crucial technical level review
S&P500 technical level review
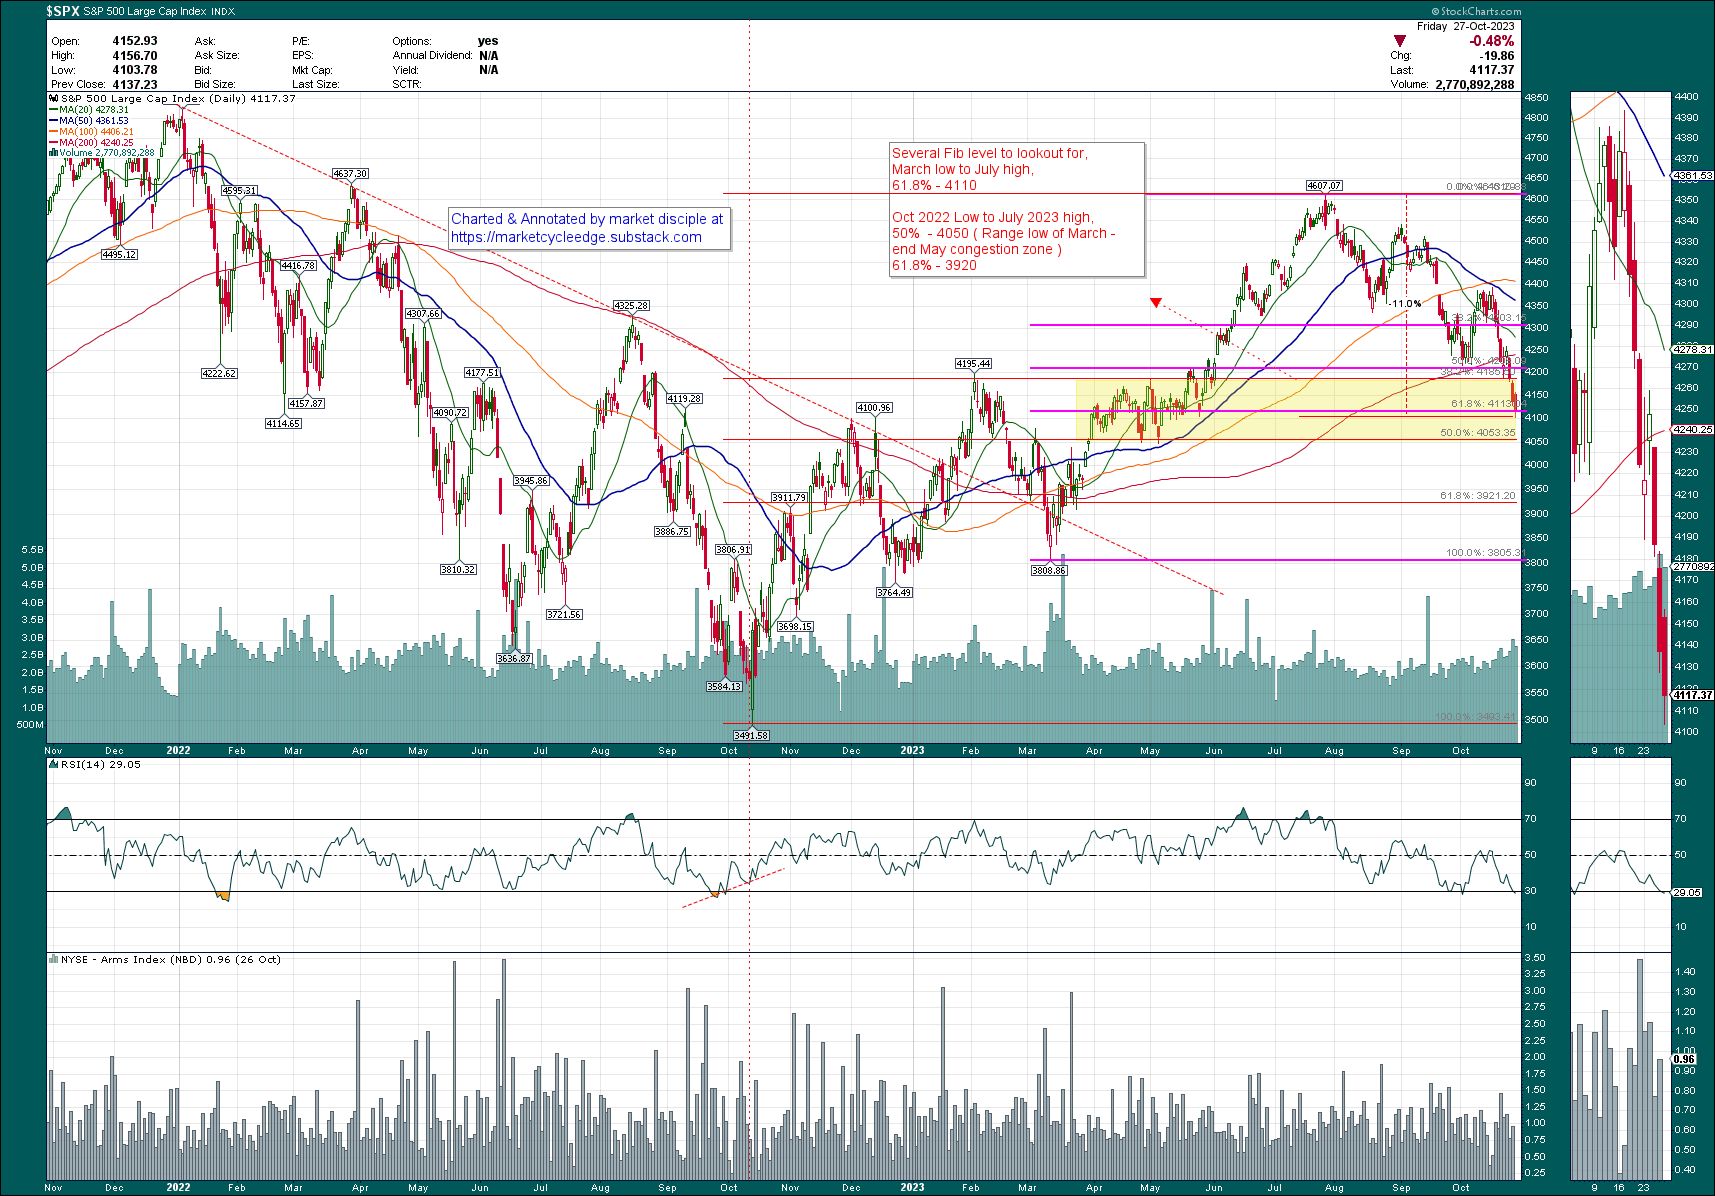
Fibonacci Retracement of 2 most important price swing,
From 2023 March low to 2023 July High
61.8% Fibonacci retracement : 4110
From October 2022 low to July 2023 High
50% Fibonacci retracement : 4050
61.8% retracement : 3920
Coincidentally, 4050 – 4200 is congestion zone ( liquidity base ) before March low to July high, so price action around liquidity zone bear watching.
Anchored VWAP
Anchored VWAP ( Volume Weighted Average Price ) is a very popular tools among Trader and Fund manager, it’s an indicator that calculates average price of stock weighted by its trading volume over specific time period.
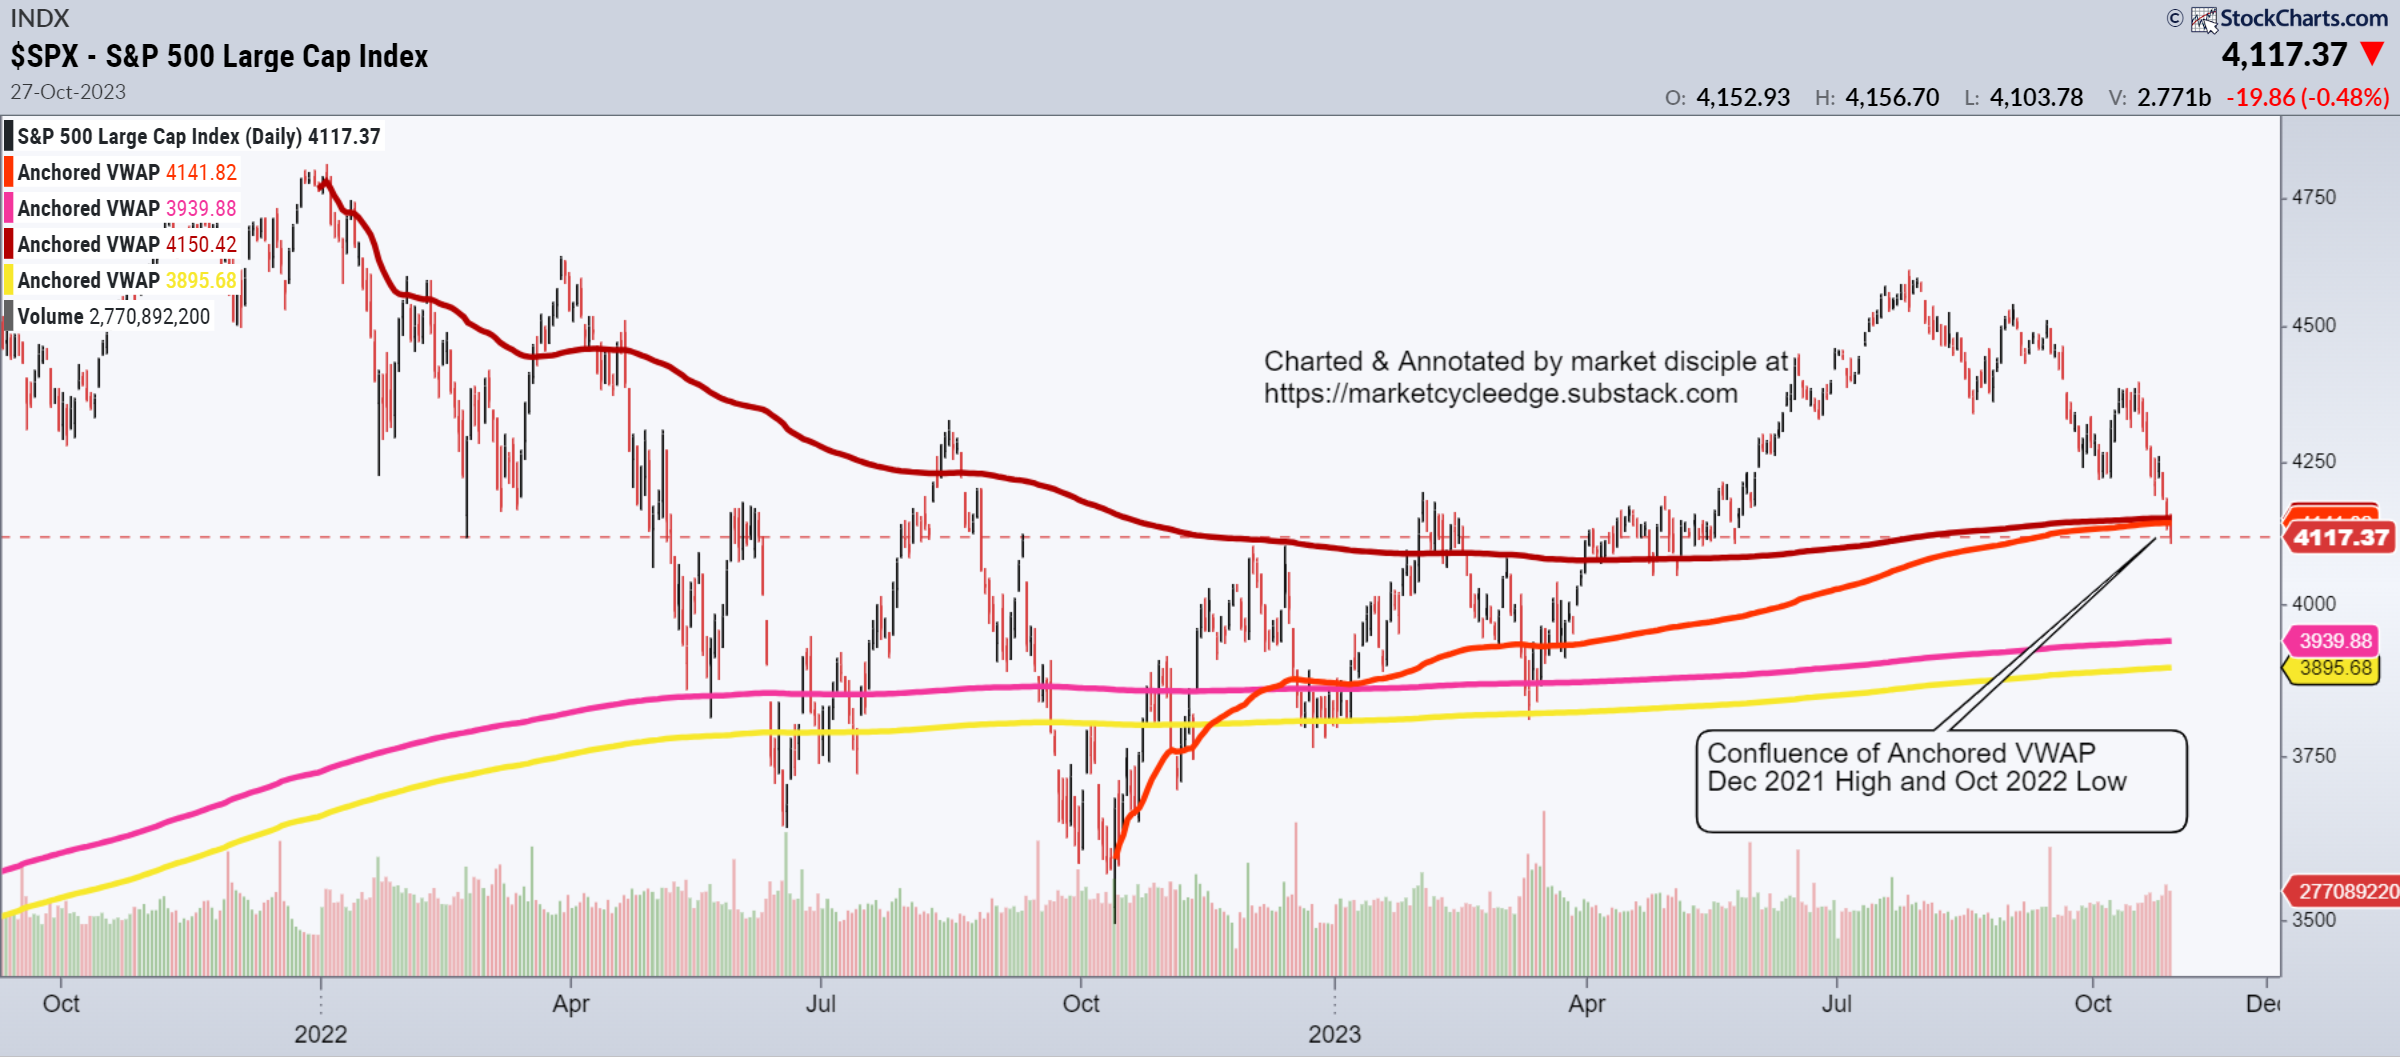
2 important Anchored VWAP
Dec 2021 High ( 4818, highest close of SPX ): 4150
Oct 2022 Low(3491, Oct 2022 low of SPX ) : 4141
If SPX drop lower, then we will have to look at
Precovid Swing high ( Mid Feb 2020 ) : 3940
Covid swing low ( mid march 2020 ) : 3895
200 week Moving average
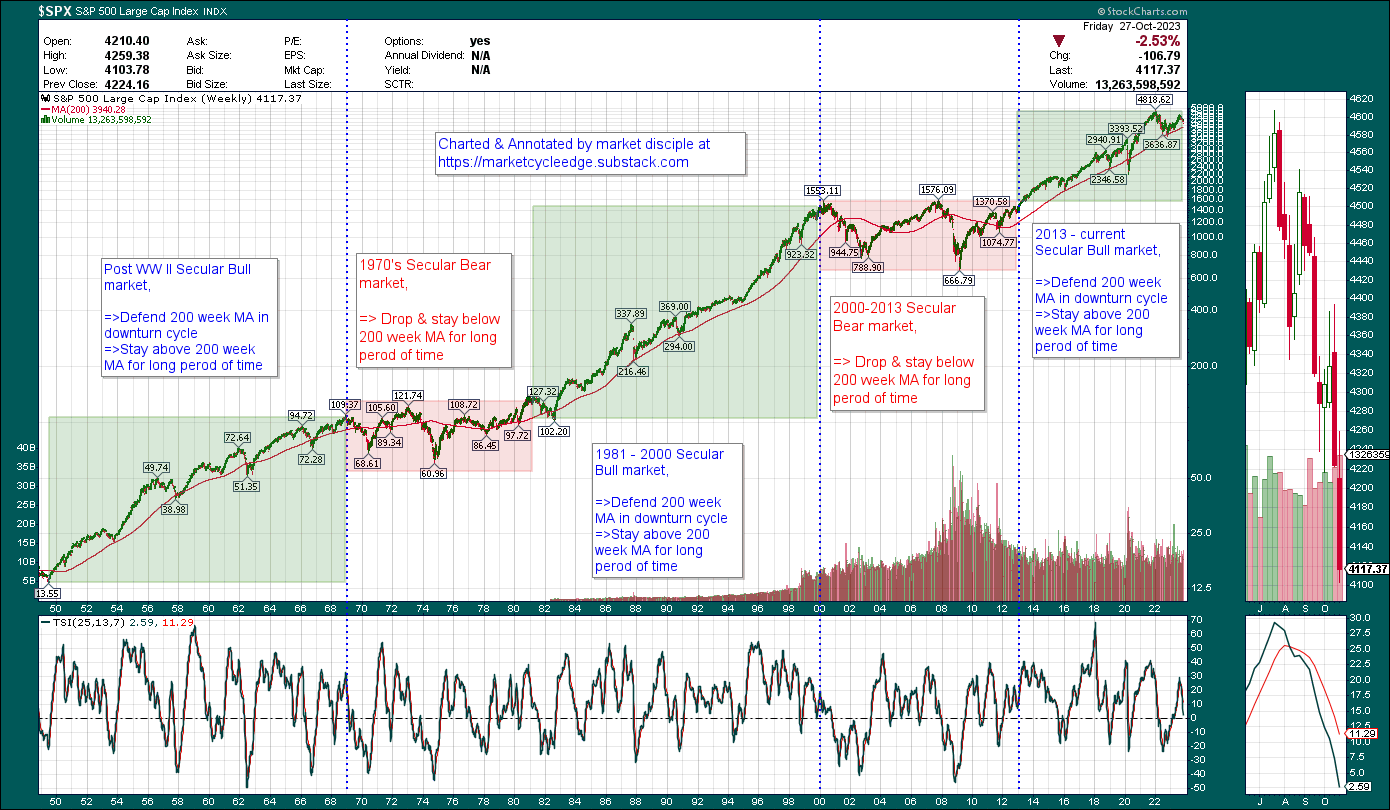
This is the arguably most important line in the sand. Throughout past Secular bull market ( Post World War 2 – end of 60’s , 1981 – 2000, 2013 – current ), 200Week MA either defended the bear cycle drop or had very brief stay below 200Week MA.
The most recent successful defence was around 3500 at October low
200Week MA is currently at 3940 . the longer it stays below the more concerning it becomes.
Bearish / Bullish Macro scenario planning
As investor/trader, we have to think of multiple scenario to ready ourselves for every curveball that market will throw at us.
Bearish scenario planning
Doom&Gloom news are front and center in the financial media, example as follows,
https://fortune.com/2023/10/01/recession-still-likely-and-coming-soon-6-reasons-why/
but the most relevant chart/reason that I have came across are, real 10Y yield too tight ( above 2.25 after deducting inflation rate )
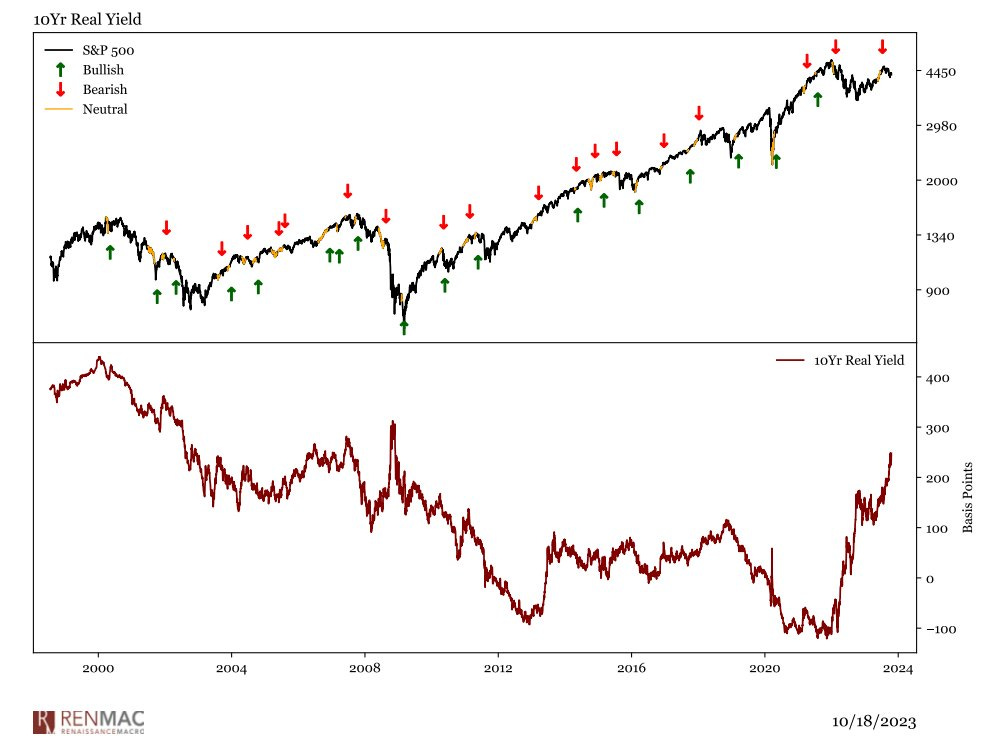
Sources : Renaissance macro research
According to Renaissance Macro research, real10Y yield going above 2.25 it starts to affect Stock market negatively and exponentially, the higher 10Y yield goes above 2.25 the sharper the decline in S&P 500. Currently, Real 10Y yield is at 2.5 as we speak.
Therefore pay close attention to all above-mentioned SPX level as we decline further, 4050, 3920- 3940., for technical reasons listed above to see if the SPX decline can be arrested at any of these level for reasons stated above. In particular, if 3920 – 3940 Level cannot stop this decline and indices stays below 3920 - 3940 for long period of time, then things will really crumble unless Fed reverse course decisively.
Bullish macro scenario planning
As there are no one expecting any turn around when indices are thrashed, we need to more creative and think of multiple scenario to better prepare ourselves mentally if things do quietly recover.

Bullish Scenario 1 : 10Y Yield peak and reverse/ Retest 5% and roll over
This is preposterous, how could you suggest 10Y yield peak, when …. Hear me out 1st. Bill Ackman is in the Fed Investor advisory committee, and he was most recently giving a presentation to NYFED chair John Williams on Oct 19th.
He had been betting against long duration bond fall ( yield UP ) and curiously stop in October. Maybe he sniffed out something that we don’t ?
Also Yellen mentioned : So I think it’s perfectly possible that we will see longer-term yields come down, but nobody really knows for sure.”
https://www.newyorkfed.org/aboutthefed/ag_financial_markets
https://www.newyorkfed.org/medialibrary/media/aboutthefed/pdf/2023/October-2023-IACFM-presentation
https://finance.yahoo.com/news/bill-ackman-says-covered-short-151015249.html
Bullish scenario 2 : Bank Run crisis
Bank crack as Fed intend to prove a point and maintain their inflation busting credibility ? If banking crisis happens, Initial bearish shock followed by bullish run, banking crisis will force Fed to bail on their hawkish tone immediately, and launch Stealth QE ( Bank term funding programme ).
Bullish scenario 3: Market getting used to high yield and bad news
10 year yield may well stay around 4.5 – 5% for quite a while, and market will get used to it & regain footing after some time. Taking a look at City surprise index ( shows how economic data compares with consensus analyst expectations, the higher the number the more actual data beating market expectations we get), If US economy has so resilient, eventually the goods news is bad news environment ( market expecting hawkish fed based on good data ) will turn in good news is good news environement especially once market expect Core PCE to keep trending down to low 3 – high 2%.
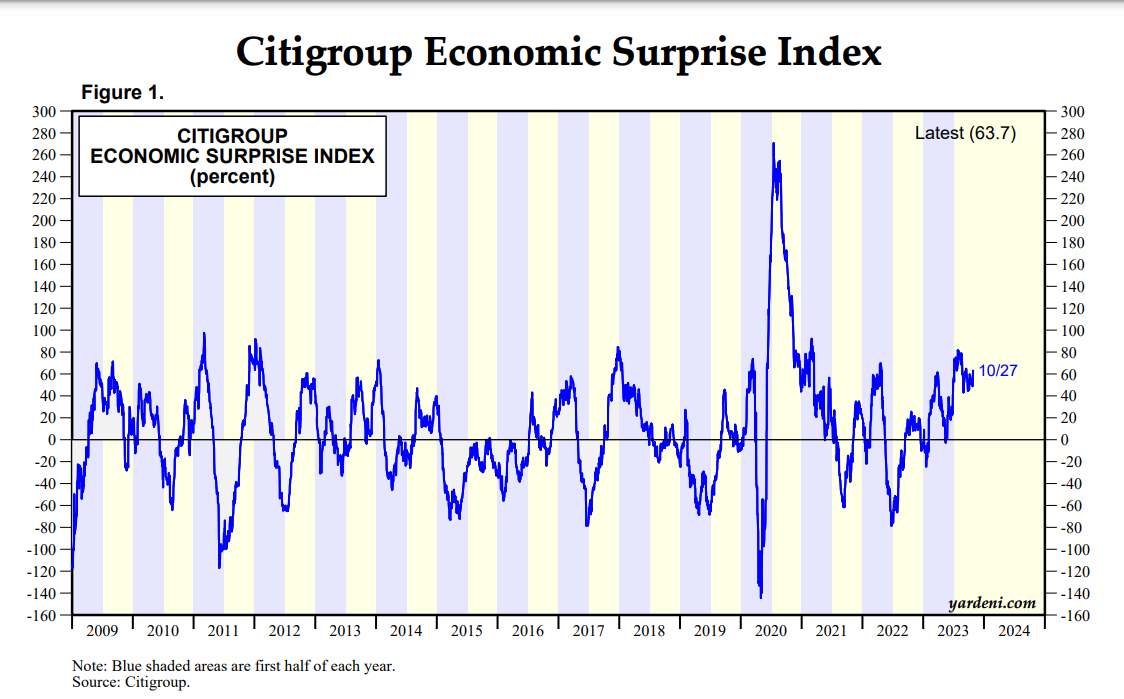
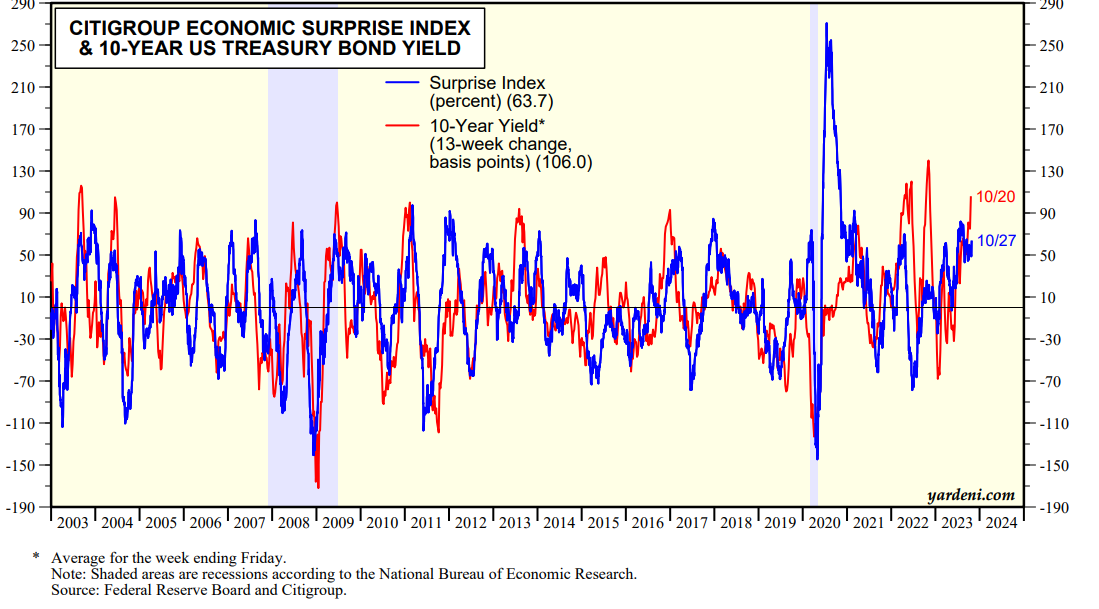
Source : Citigroup, Yardeni reseacrh
In the below chart, Ed Yardeni overlay both 10Y yield with Citi economic surprise index. Could it be that 10Y yield has more to do with economic strength and growth, rather than inflation or other gloomy worries ? I Believe market will eventually come to realize that especially when SPX start rising and stay above 4280 swing high, more of such news will appear in the financial media.
Bullish scenario 4 : China liquidity spigot /Huge stimulus
China Turning on their liquidity Spigot and economy recovering ? This is another one that fly in the face of “common sense”/market consensus.
But if one look carefully among all the China doom and gloom news, there are signs of China authority taking action to arrest the economic slump.
Various signs include but not limited to,
1) PBOC liquidity injection
2) Set up fund to buy (prop up ) stock market
3) Launching various new stimulus
China Economy is starting to have some recovery momentum behind, as shown in the chart below, based on Crossborder Capital research
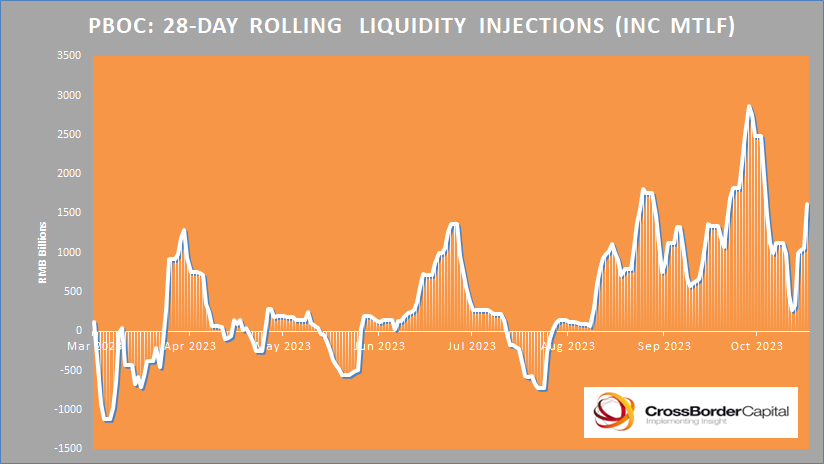


Sources: CrossBorder Capital
https://asia.nikkei.com/Spotlight/Caixin/China-state-owned-companies-buy-back-shares
Scenario 5 : Shift in Fed tone
Fed announce that Inflation war has achieved major progress/sounds less hawkish than before as market continue to decline and tighten the financial conditions for them for fear of walking into a disaster ? Let’s not forget that Fed chair and various fed members has said recently in their speeches that 10Y yield increase has tighten the rate for them.
The Technical signal/footprint that accompany various selling climax/panic buying can usually be found in high put call volume ratio NYSE D/A , A/D breadth thrust, ARMS index, NYSE Up/Down Volume, while Selling subside can usually be found in divergence of breadth/momentum readings
In upcoming part 2 of the market weekly review, we will review all the price charts, breadth, momentum and bond charts.
As always, we will continue to monitor the charts, assess the bullish/bearish evidence day-by-day to make appropriate capital allocation and investment decisions.
Disclaimer : The information presented here are for research and education purpose only, and does not constitute investment advice, trading recommendation, author shall not liable for any action taken by any individual/company with regards to the information presented here or any part of the website - https://marketcycleedge.substack.com/