
Weekly market review Nov 27 – Dec 4 2023 and state of market (Mid & small cap , equal-weighted outperform cap-weighted, different lenses on consolidation)
Weekly market review Nov 27 – Dec 4 2023 and state of market (Mid & small cap , equal-weighted outperform cap-weighted, different lenses on consolidation)


Broad market overview

Mid & Small cap had a big bullish bar for 2 consecutive day. Equal-weighted outperform Cap-weighted counterpart. Transportation is also outperforming major indices, all these show participation is broadening, market is morphing into unrelenting, well-rounded bull, and Magnificient 7 is not the only show in town.
Nasdaq 100
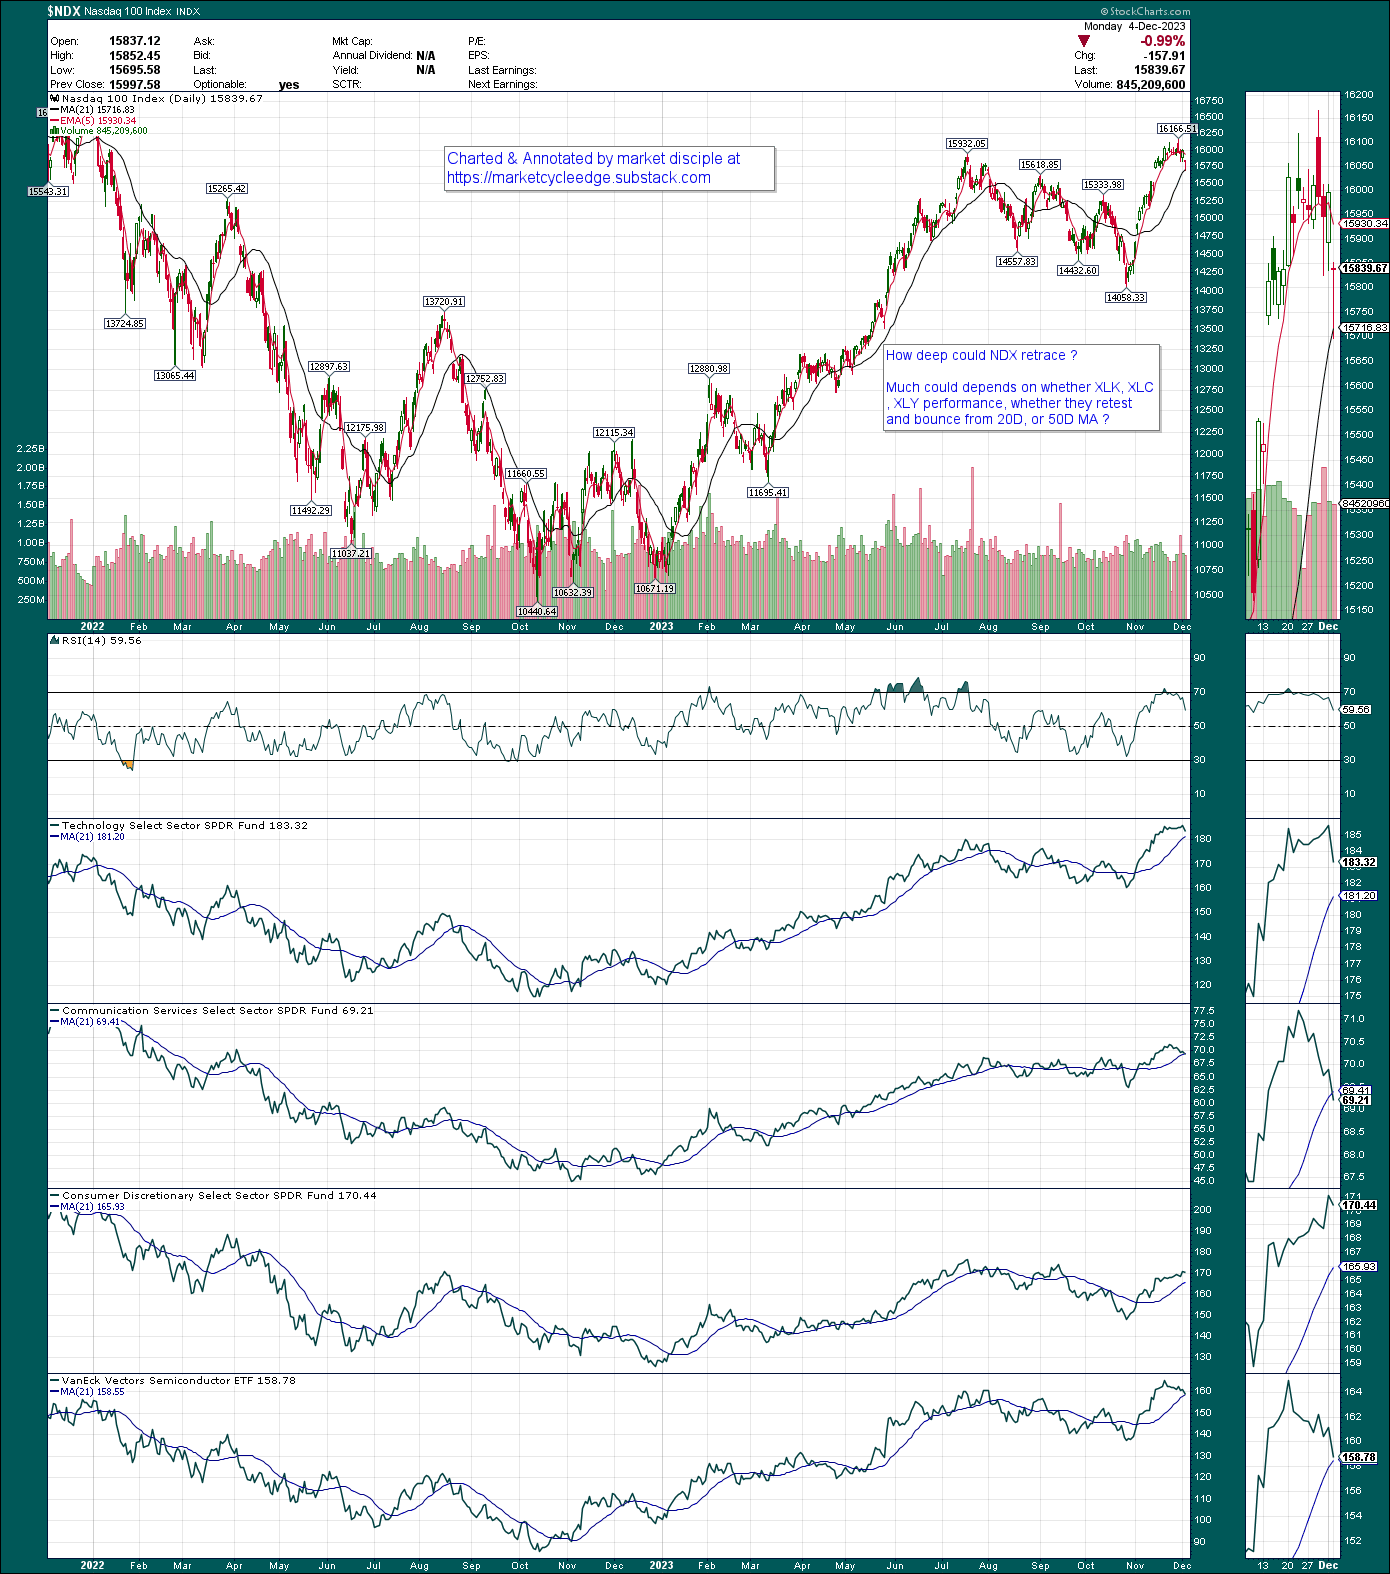
As technology and semiconductors has been leading the market in 2023 so far, we need to look at their chart to gauge market movement.
Technologies, Communications, Semis, and Consumer discretionary are bouncing off 20/21Day MA.
As for how deep NDX retracement could go, we need to look at whether 5D cross below 21D MA or if those aforementioned sectors retest deeper MA.
If 5 day cross below 21 day, there could be a bit of a further retracement ( suspected to be institution selling to shakeout some weak hand, or tax loss harvesting )
S&P 500
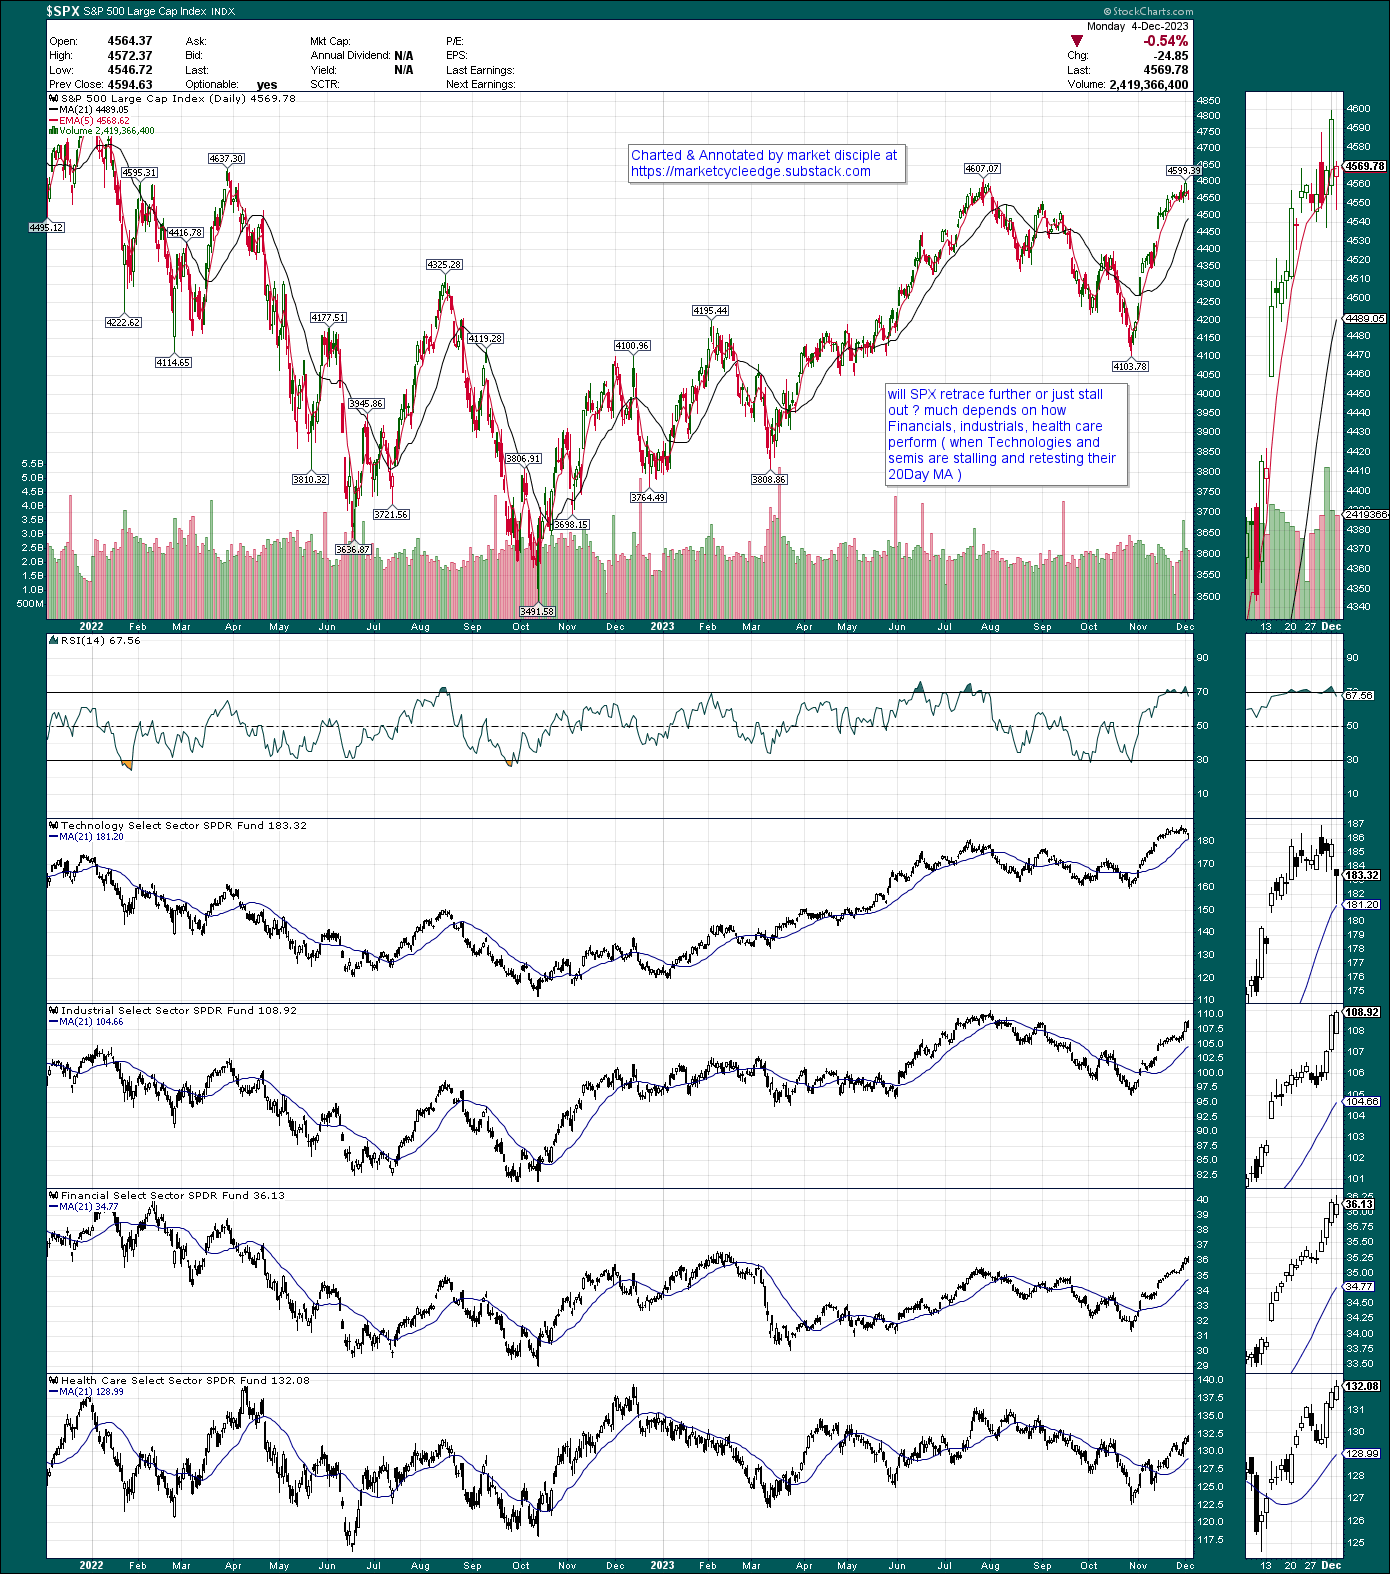
All these talk about retracement could be moot and stalling could be brief, if other sectors took over the leadership to push market (S&P 500 ) to a further high while Technologies, semiconductors ( along with communications and Consumer discretionary ) is taking a rest before leading the broad market rally again down the road.
So 2 scenarios going forward
Correction in time : market stall while other sector (ex tech, semi and offensive sectors ) take over leadership. And Subsequently, technologies lead another round of broad market rally again .
Correction in price : slightly deeper retracement ( 5 EMA cross below 21day MA , albeit briefly ) 3-5%
Honestly , at this point it’s 50% - 50% in each scenario , and could go either way based on price action and sector analysis.
Here’s another different lense on the market.
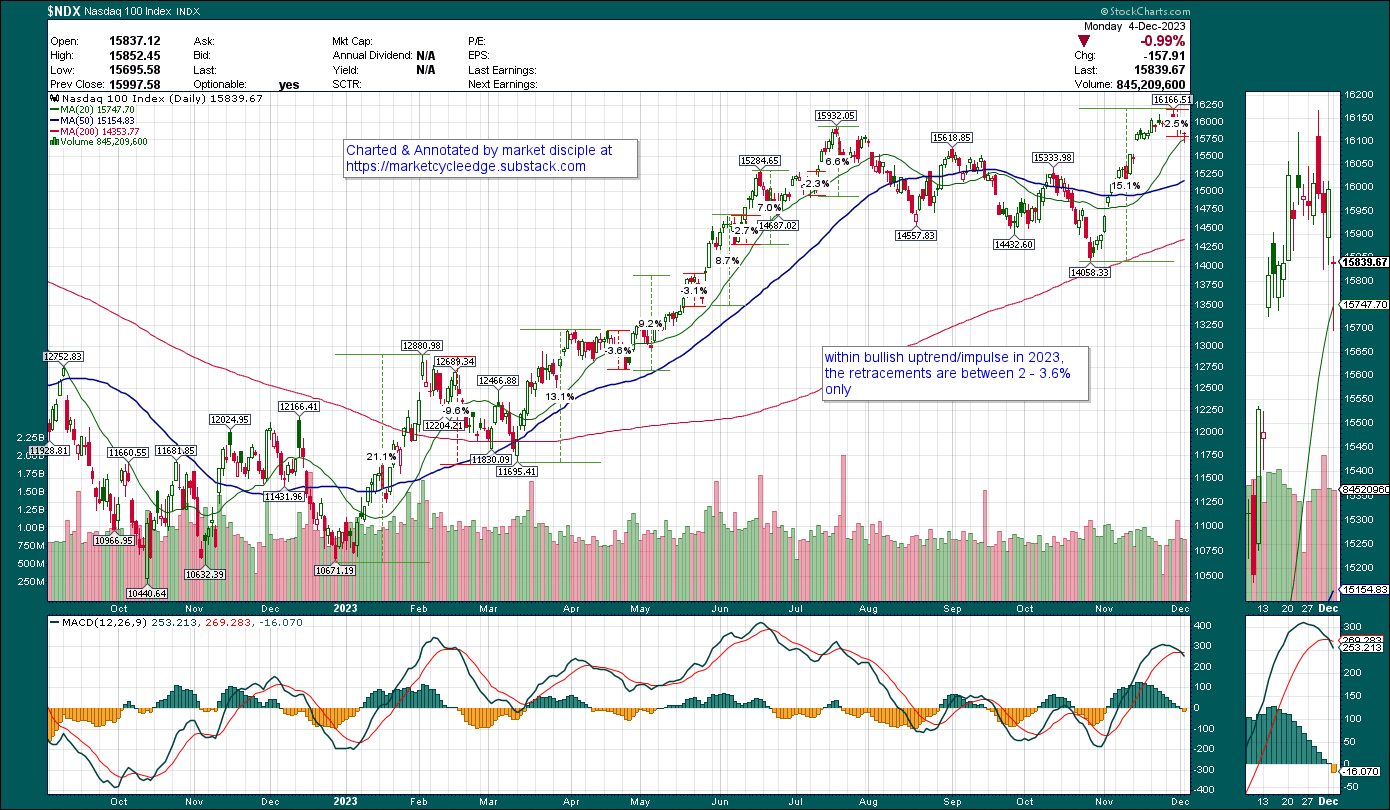
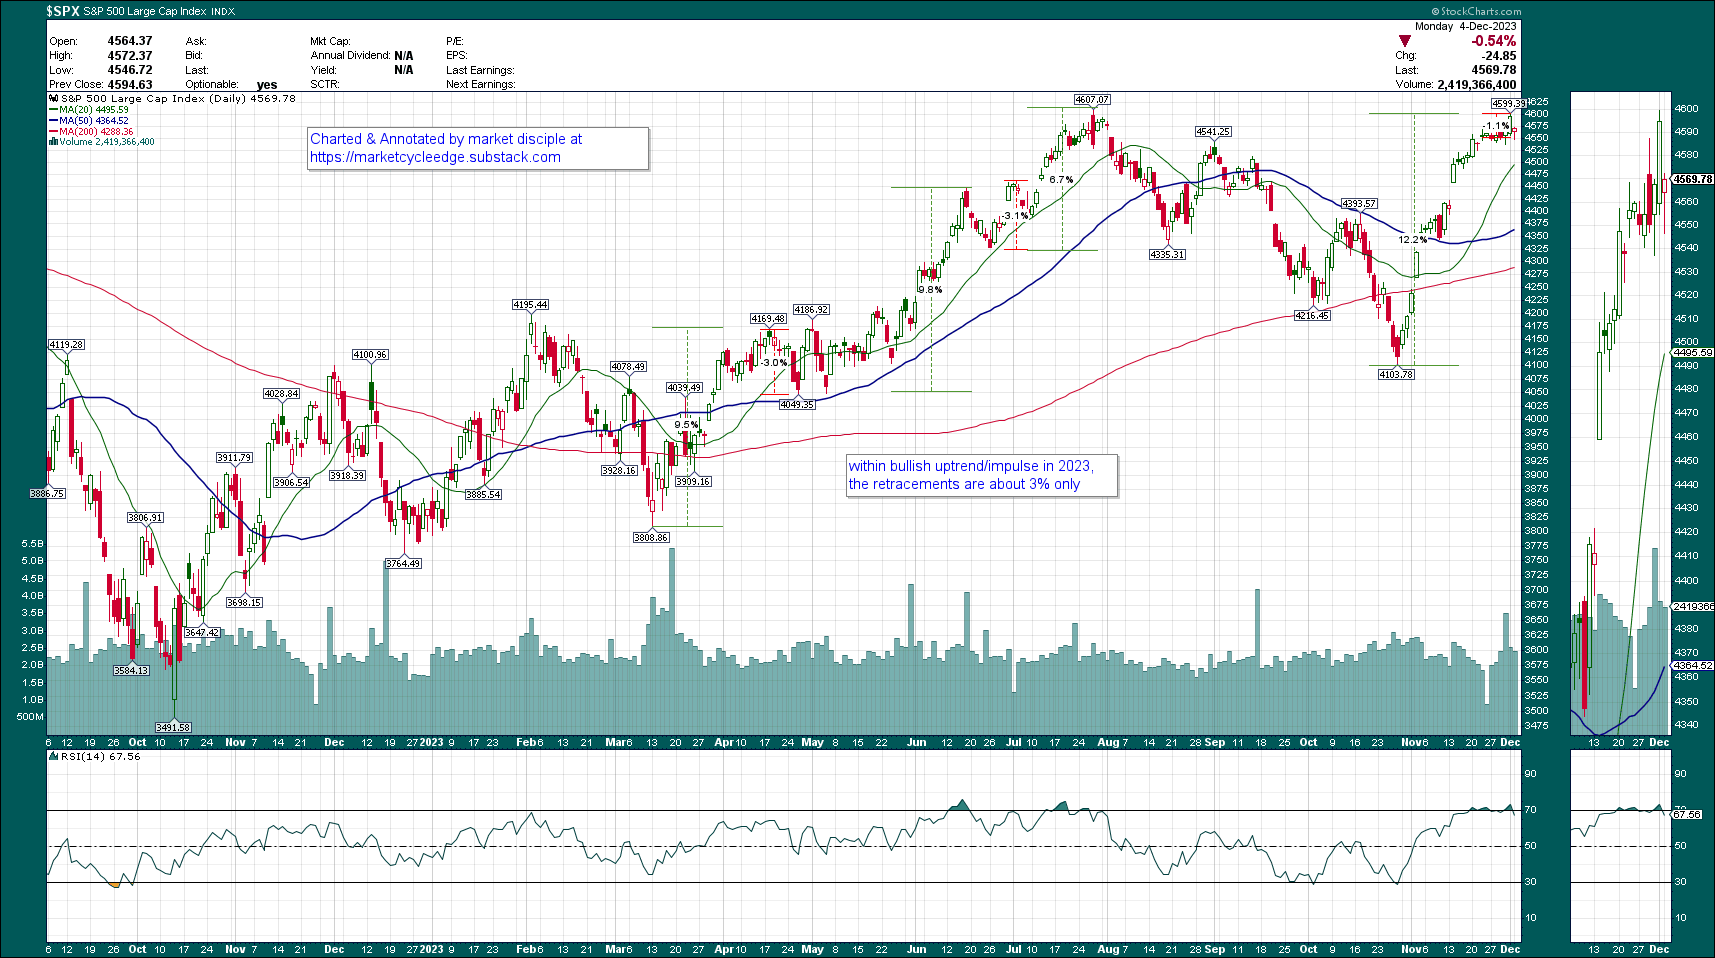
Analysis of rally and retracement % so far in SPX and NDX, shows both had very brief retracement ( 2- 3% ) once price is inside bullish impulse wave.
Weekly chart

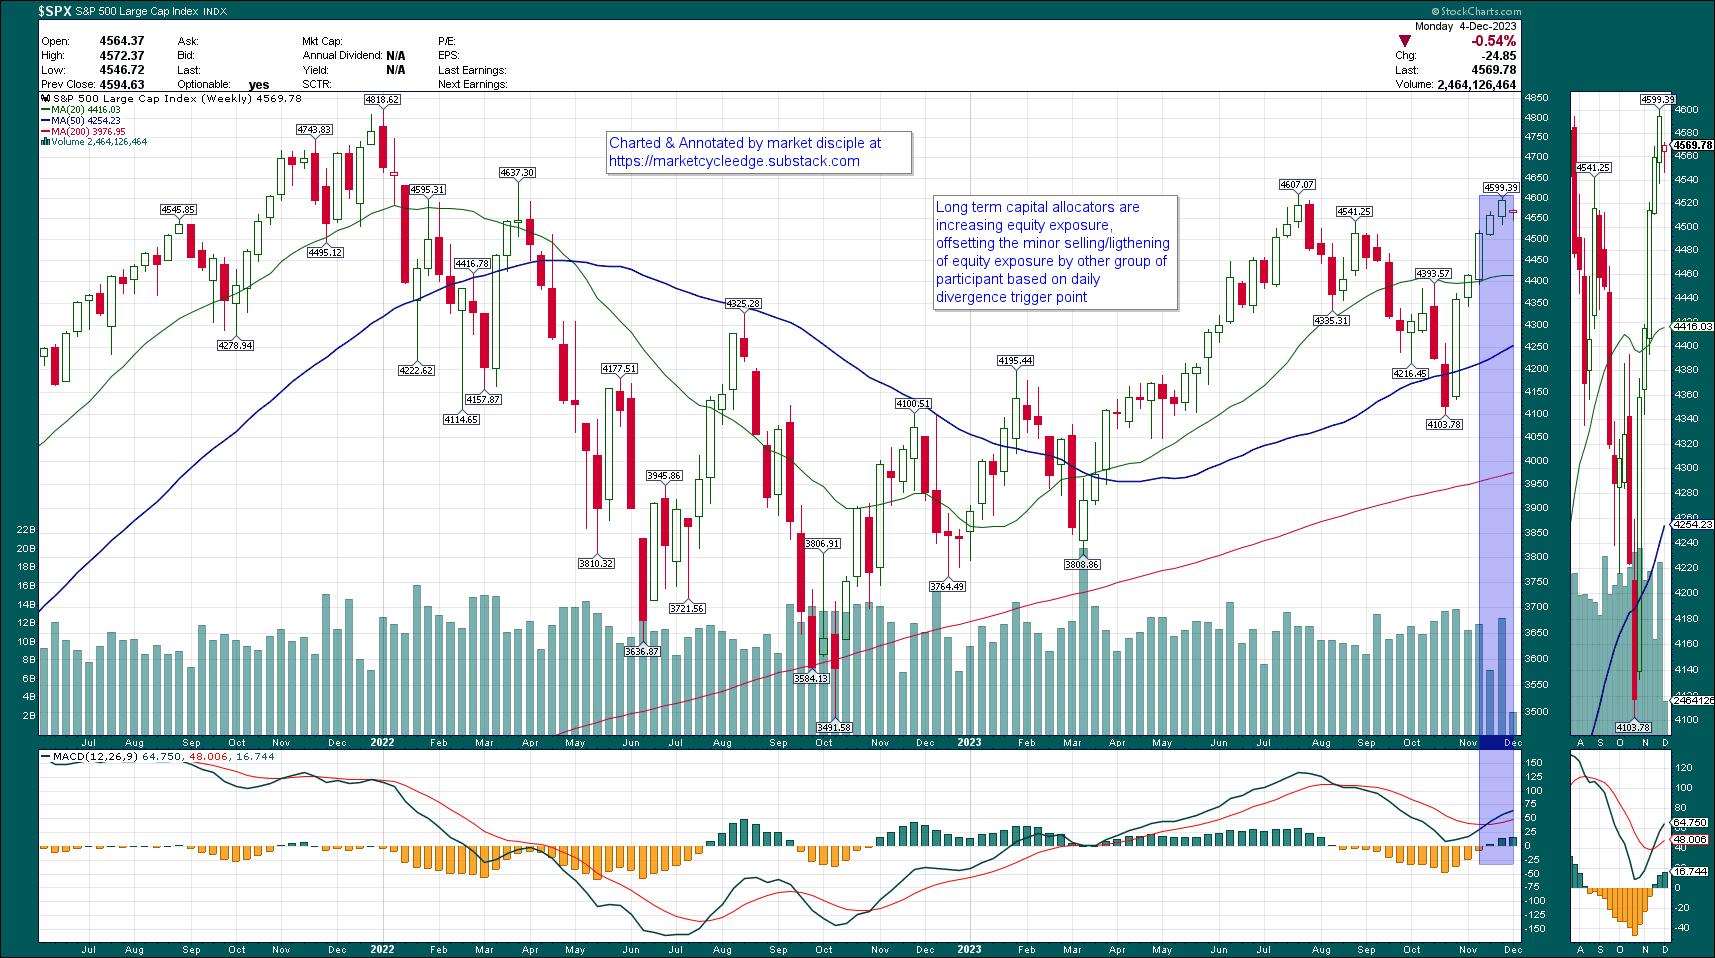
Longer term capital allocators based their decisions on weekly chart. when weekly chart had some MACD/PPO cross over 2-3 weeks ago, they would have started to increase their allocation to equity asset and is continuing to do so, these continued longer term capital allocation flow might offset some of the “selling”/retracement in the daily timeframe ( daily chart divergence in McClellan oscillators or RSI turning down etc.. in NDX SPX )
MOVE index

MOVE index closed at around 118, may go up to 120 level if 10Y yield retest 4.5 level, index will likely fall if it happens. In the mid – long term, would like to see it moving closer to 100 in the coming month. ( Lower MOVE index decrease bond haircut, causing an increase in collateral value of bond, leading to more fund available for big institutions, thereby increasing market liquidity. )
Dollar index (DXY) & 10Y yield (TNX) negative correlation with Stock indices
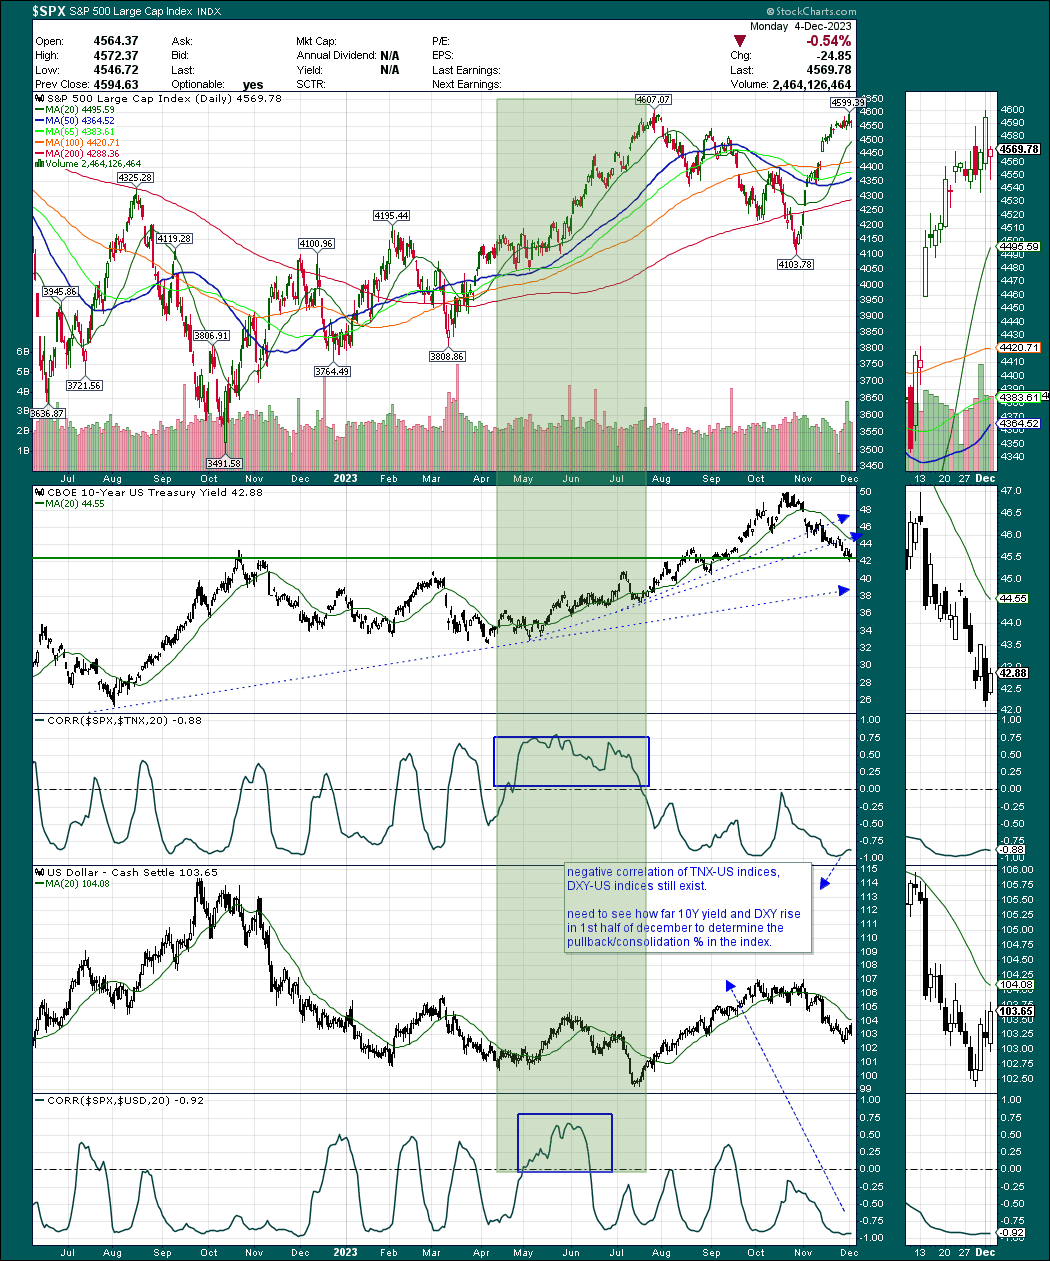
Negative correlation between TNX-US indices, DXY-US indices still exist & are strong.
We will need to see how far 10Y yield & DXY will rise in 1st half of December to determine the pullback/consolidation % in the index.
NYSE market internals

Friday Dec 1, 5.86 to 1 NYSE Advancer to Decliner ratio ( 2469/421 )
Monday Dec 4, 1.03 to 1 NYSE Decliner to Advancer ratio ( 1451/1414 )
Sector performance on 1 week basis
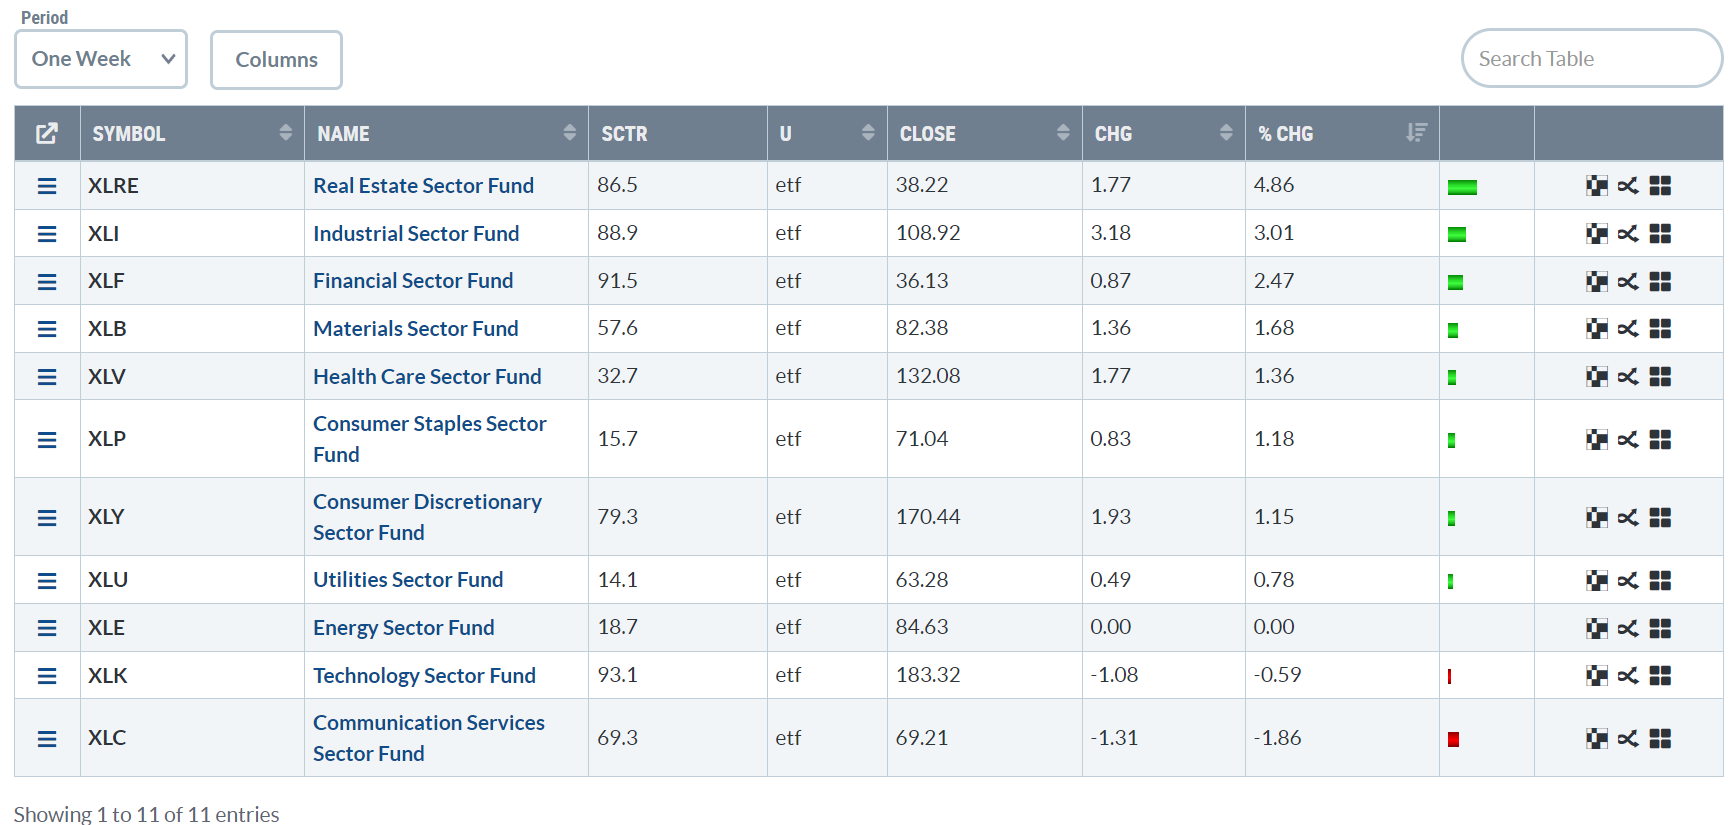
On 1 week basis, offensive sector (Technologies, Consumer discretionary) are underperforming of Defensive sectors ( Consumer staples and utilities ). Finance and industrial are outperforming defensive sectors, which is a plus point
Charts that suggest possibilities of imminent pull back
10Year Yield (TNX)

10Y yield closed near 4.3%, near support level, chance of SPX pulling back in the near term cannot be rule out
Junk bond press higher after gapping up a few days ago, Junk bond movement could offer clue to Stock indices very near term movement
% of SPX stock above 50days MA
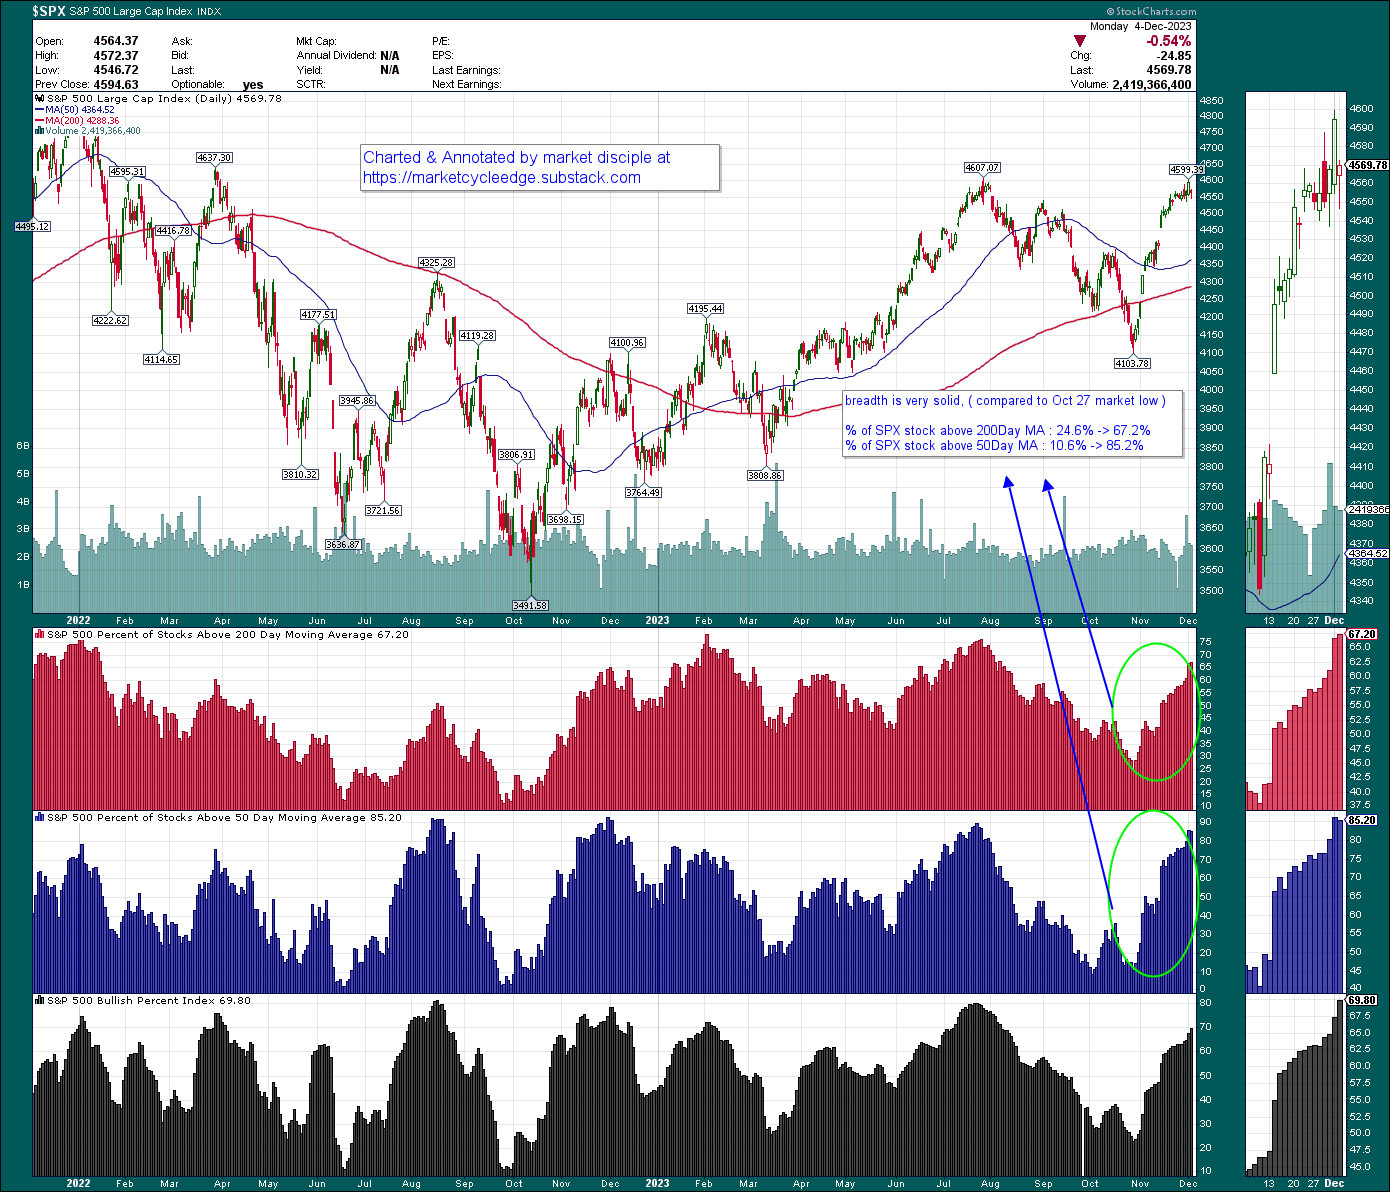
Market breadth is very solid ( but getting nearer to too solid for % of stock above 50days MA)
percentage of SPX-Stock above 200days-MA, currently at 67.2% .
percentage of SPX-Stock above 50days-MA, currently at 85.2% . getting close to oversold level, conditions are ripe for market pullback. If pullback/consolidation doesn’t happen immediately, then market likely will run up to high 80% or even 90% before consolidation/pulling back sets in.
NYSE McClellan Oscillator

SPX made a higher high, but NYSE&Nasdaq McClellan Oscillator is still making a lower high, potential divergence in development, signalling that breadth is less good underneath the surface. We will observe a few more days for the pull back occurrence
Bottom line
Short term : pullback likely due ( how shallow/deep is anyone guess )
Mid term : bullish
Long term : bullish
As always, we will continue to monitor the charts, assess the bullish/bearish evidence day-by-day to make appropriate capital allocation and investment decisions.
Disclaimer : The information presented here are for research and education purpose only, and does not constitute investment advice, trading recommendation, author shall not liable for any action taken by any individual/company with regards to the information presented here or any part of the website - https://marketcycleedge.substack.com/