
Weekly market preview Apr 8 - 12, 2024 (market is still indecisive heading into CPI report on April 10, Bitcoin trying to regain 70k handle )
Weekly market preview Apr 8 - 12, 2024 (market is still indecisive heading into CPI report on April 10, Bitcoin trying to regain 70k handle )


Broad market overview

Market had an initial scare when 300K NFP was printed, flush down upon data release but the move was faded and market closed higher than open by Friday closing. Overall, market is still indecisive and not willing to commit to a move either way, market next directional move can only be resolve after CPI print on April 10.
S&P 500 11 sectors

Industrial, technology and financials are the top ranking sectors, while Staples and Utilities lag behind all other sectors.
MOVE index

MOVE index closed at 94.31 level, ( bond price implied volatility is expected to be around 9.4% per annum. ) Consistent close below 100 level is in general bullish for market.
Bond volatility moving lower translates into lesser haircut to bond, in which more liquidity can be extracted from the collateral pool.
NYSE & Nasdaq market internals
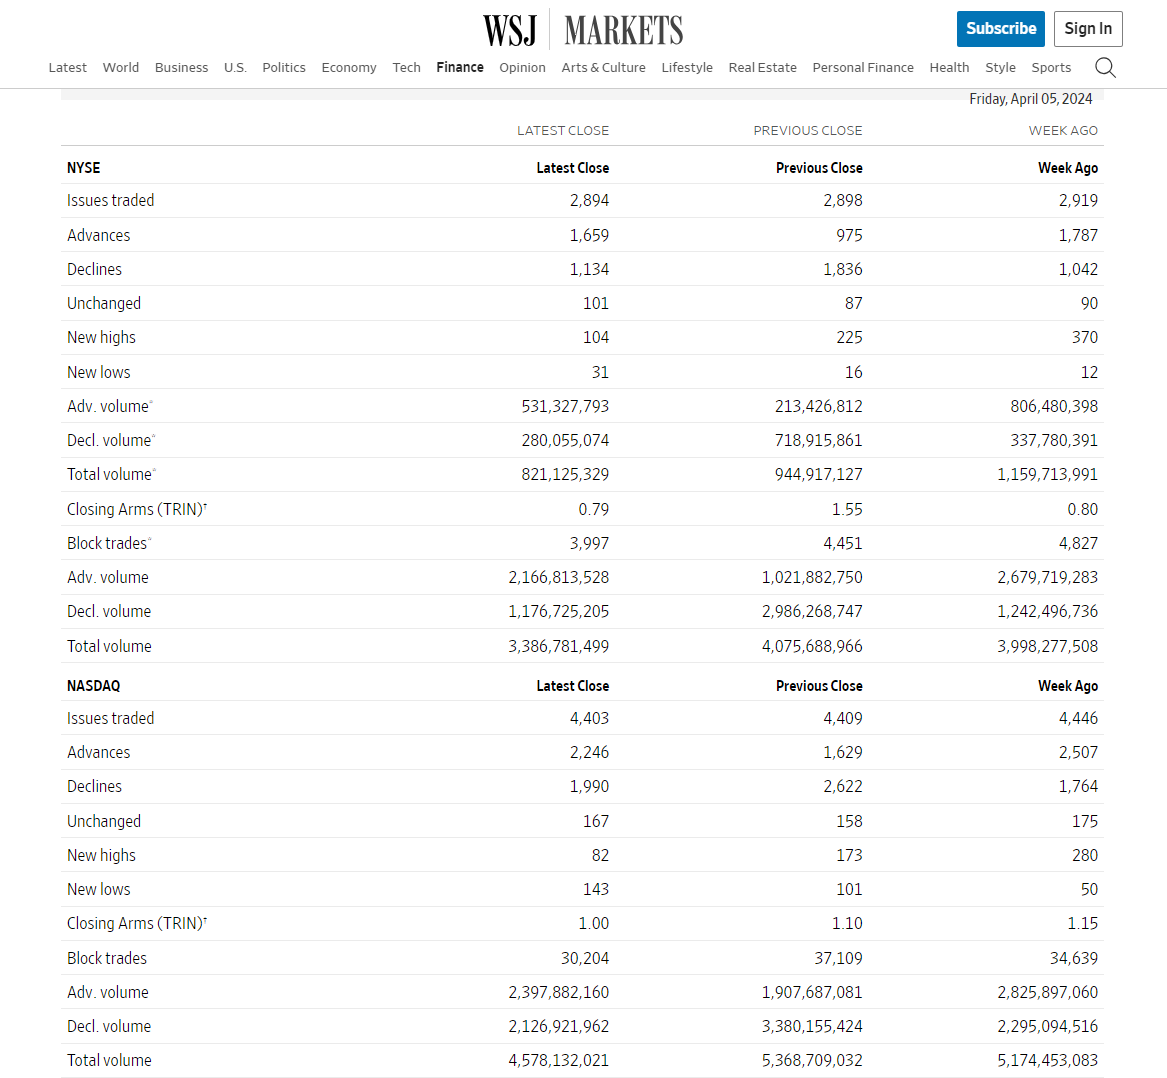
A-D ratio was nothing to shout about, less than impressive volume , increase in new low and decrease in new high. ( more obvious in Nasdaq than NYSE )
On April 5th 2024,
1.46 to 1 NYSE Advancer to Decliner ratio (1659/1134 )
1.12 to 1 Nasdaq Advancer to Decliner ratio (2246/1990 )
% of stock above 20Day, 50Day, 200Day
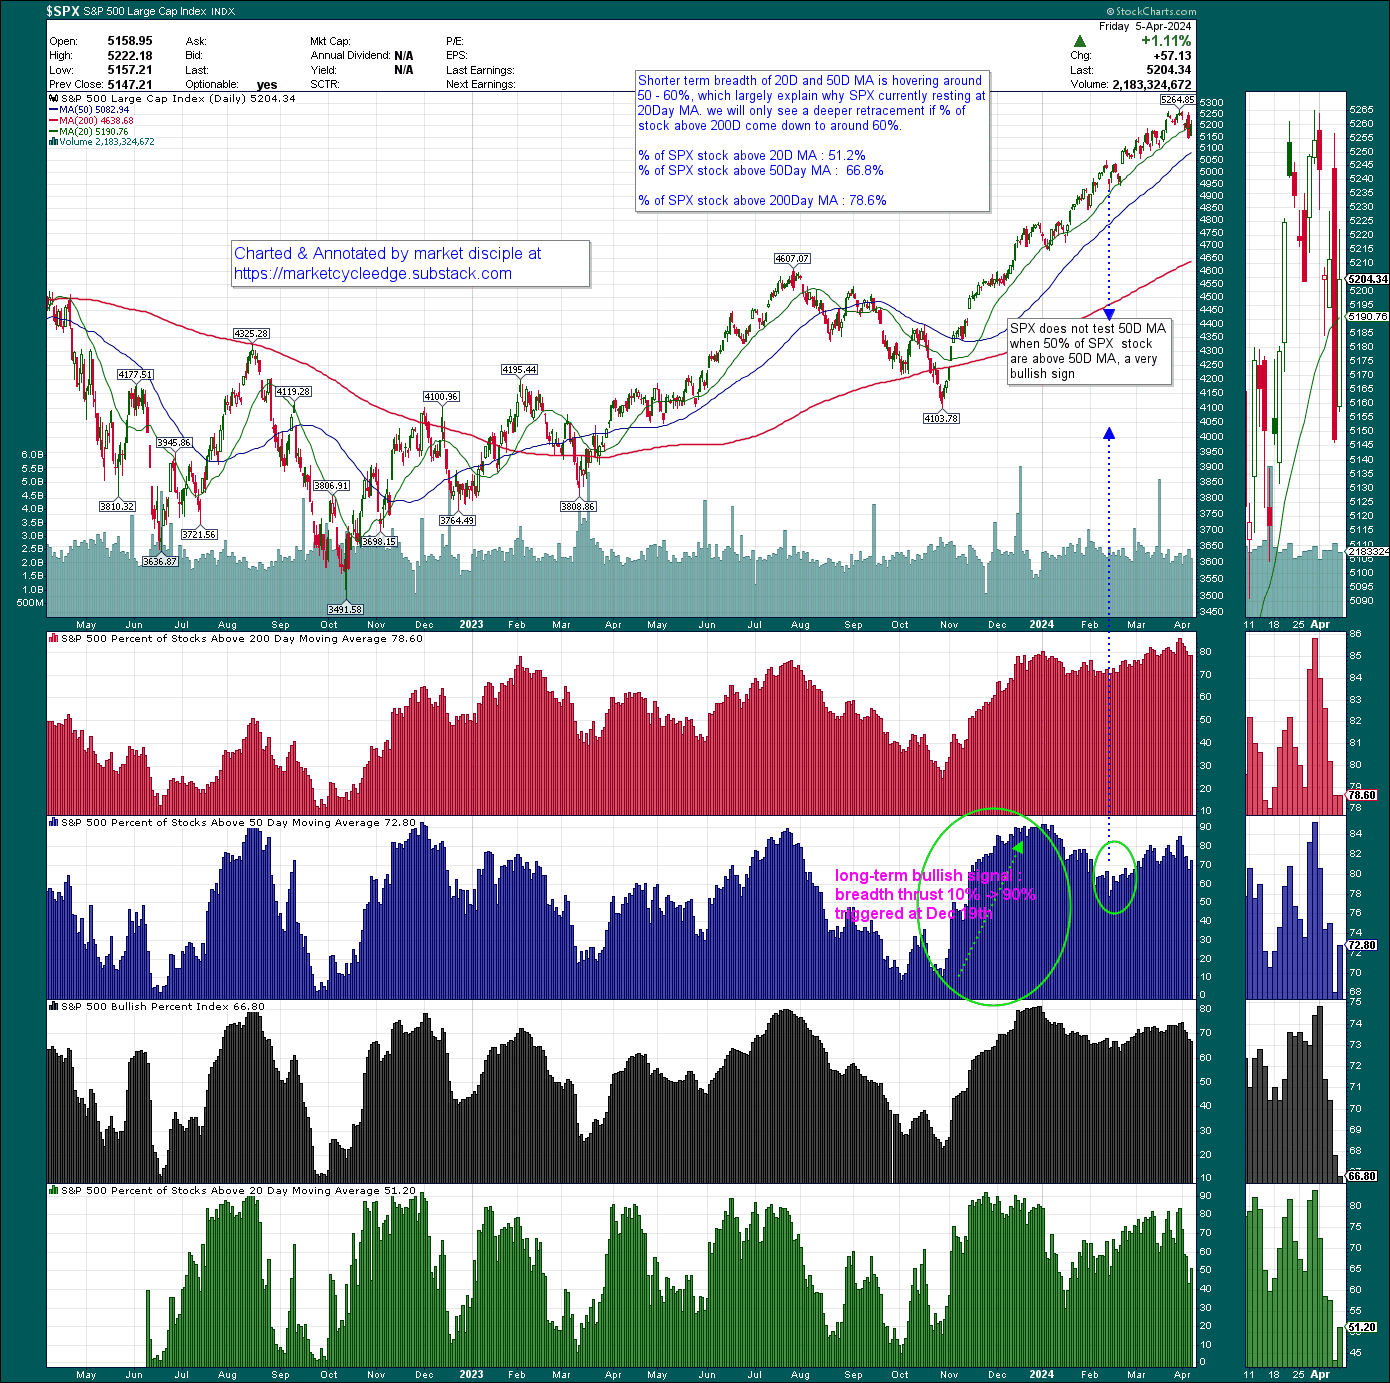
Shorter-term breadth has fallen to around 50 – 60%, which explain why SPX is resting at 20Day MA.
We will only see deeper retracement if % of SPX stock above 200Day MA drop to around 60%.
McCllelan oscillator and Summation index

SPX McCllelan oscillator is trending down again and Summation index is decreasing to sub 900 level

As for NDX, momentum as represented by NDX McCllelan oscillator is trending down significantly. Summation index has drop to sub 300 level, it’s still not showing any signs of bottoming yet.
Small cap growth base breakout
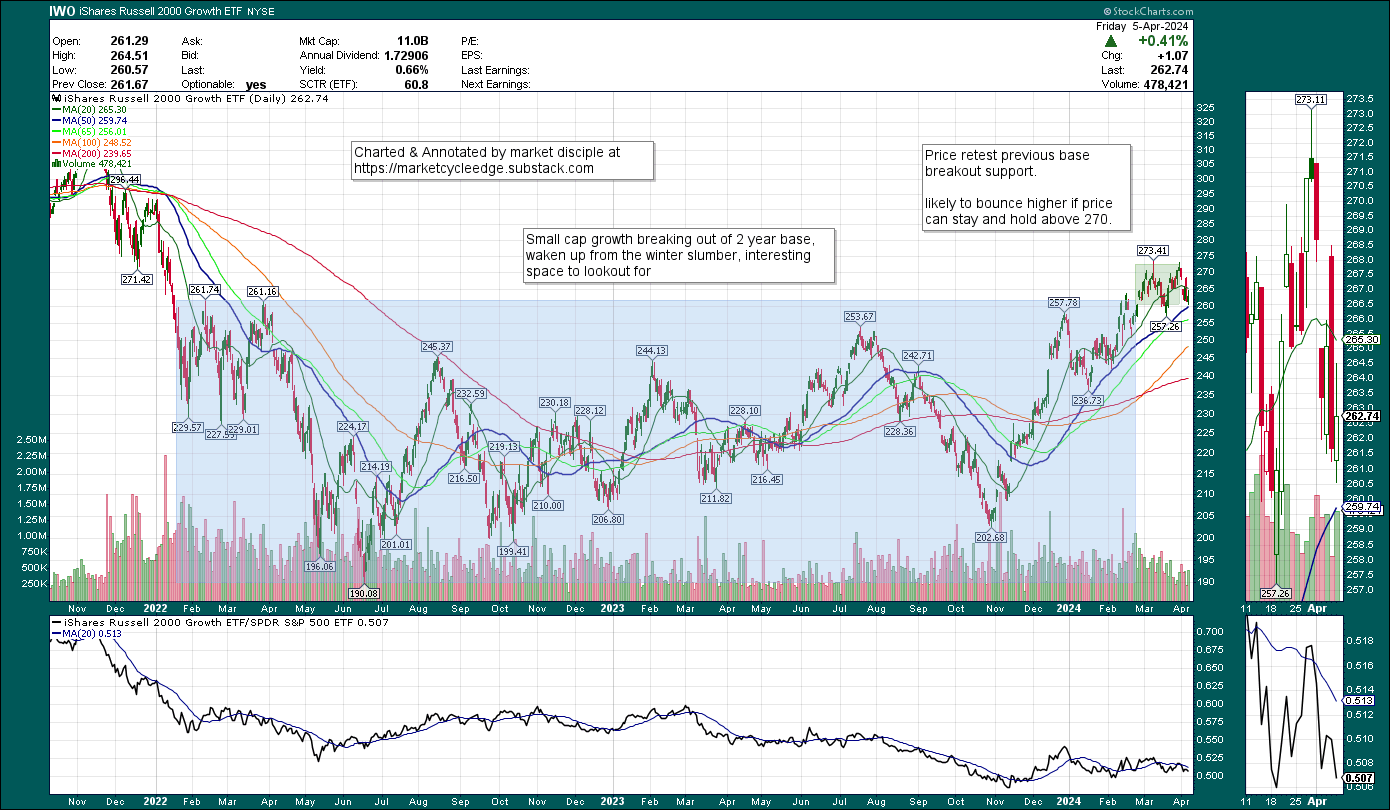
Price retest previous base breakout support. Will it retrace deeper or bounce from there ? likely to bounce higher if price can stay and hold above 270
Economic data
Relationship between 10Y yield and stock

Per Sofi data, Currently we have morphed into the positive correlation period between 10Y yield and stock price
US inflation ( EUR inflation is a preview of US inflation )
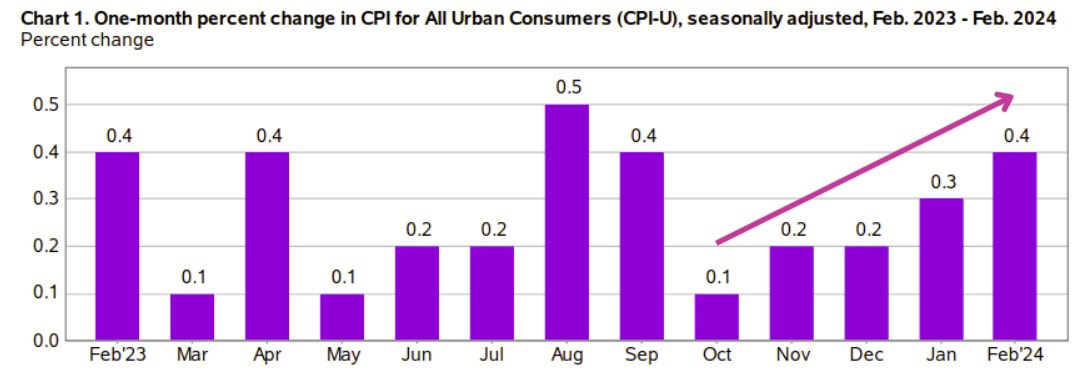
Sticky Inflation anxiety is the all angst now. The recent bout of minor retracement in equity is a response to that, this is further worsen by the recent Crude oil price, where brent crude has increase to 90 dollar per barrel.
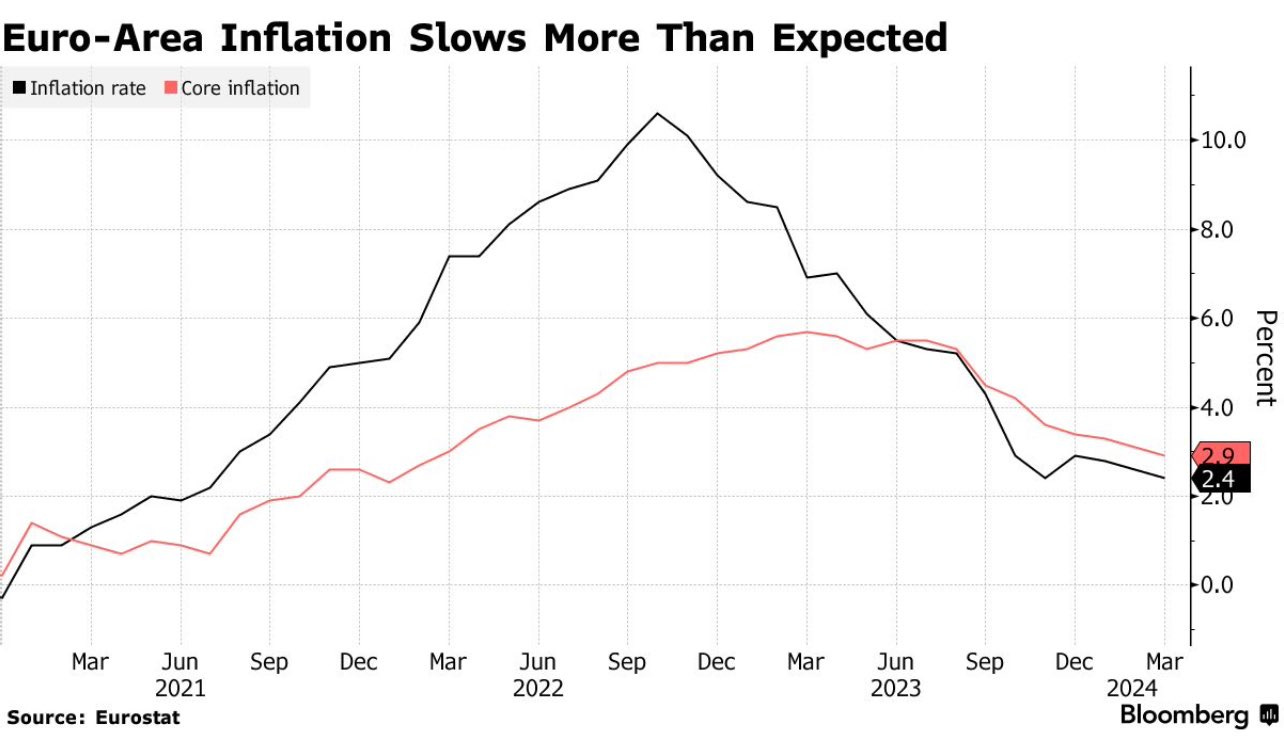
But I believe that the recent months tick up in CPI no. is really down to idiosyncratic and seasonal factors. And march CPI and core CPI should resume downtrend soon. Euro area inflation in early April release is a preview of what could happen in USA. ( expected vs actual EU CPI : 3.0 vs 2.9 ; expected vs actual EU core CPI : 2.5 vs 2.4 )
Freight ( signs of further abating in the future )
With Red sea – Houthi crisis hogging the headline previously, Vessel has to change their lane to cape of good hope and containerized freight rate increase by 50% ( Asia – Europe trade lane ). This has been worrying analyst and market participant, and many fear could trigger a new bout of inflation if it’s persistent.
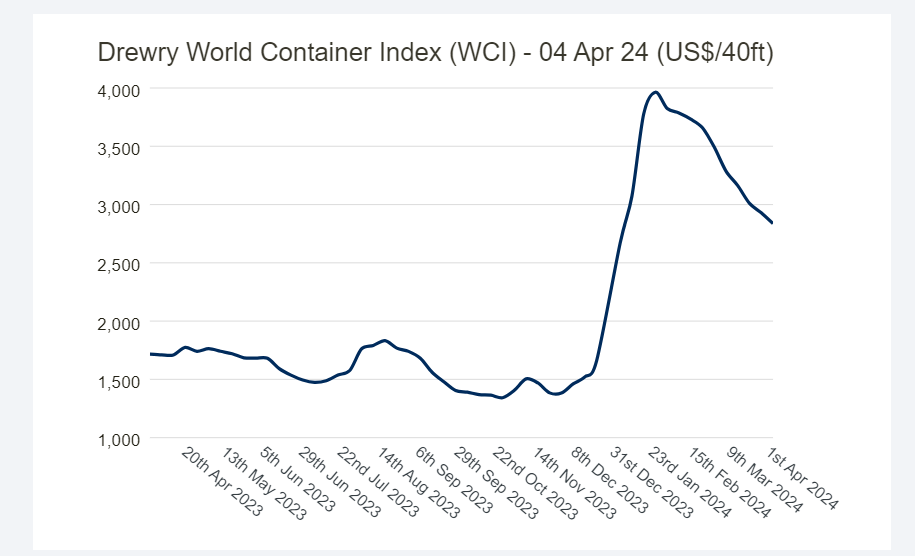

But if we look at actual data, both Drewry Containerized index and Baltic dry bulk index are going down again.
According to insiders in the container freight industry, this fear could be overblown for the following reasons,
1) There are still many excess capacities ( courtesy of covid ballooning freight induced ship investment frenzy )
2) Big increase Freight is most contained to asia-europe trade, Asia-american, Asia-latin trade is less affected and may go down in the future
3) Yearly contract renewal negotiation will start around April – May, freight sales will have a hard time maintaining high freight
Consumer on the ground experience of inflation
let’s examine consumer side of the story
Stock market and economy is hot, unemployment is low, wages are up, but why is consumer still kicking up a fuss ?
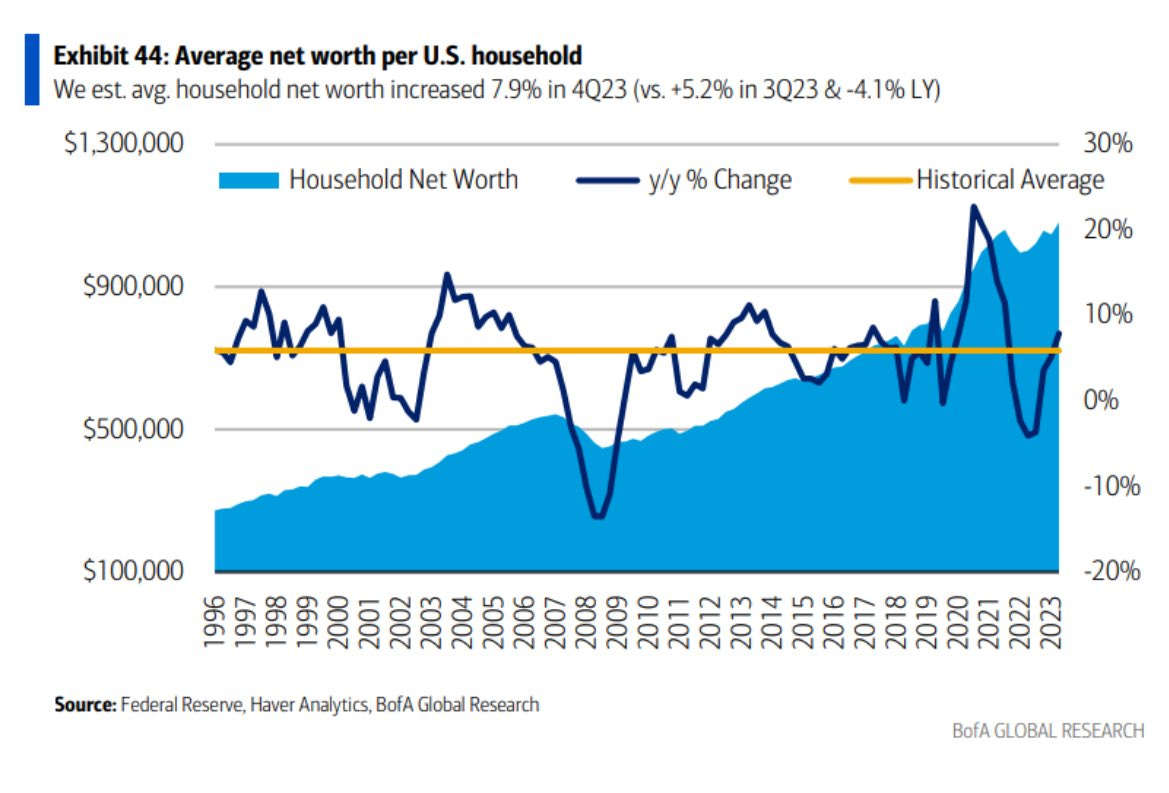
If you look at household networth statistics, things are relatively rosy. Household networth is rising and higher than historical average.

but if we look under the hood, consumer is actually struggling to keep their head above the water, according to Bloomberg data, about one quarter of US population, close to 85 million ppl are holding multiple jobs. Although there are some multi remote tech job work, but with the silent lay off in tech sectors, this group of people should be significantly lesser currently and the vast majority of them are just household who are working multiple jobs to put food on the table and keeping up with rents )
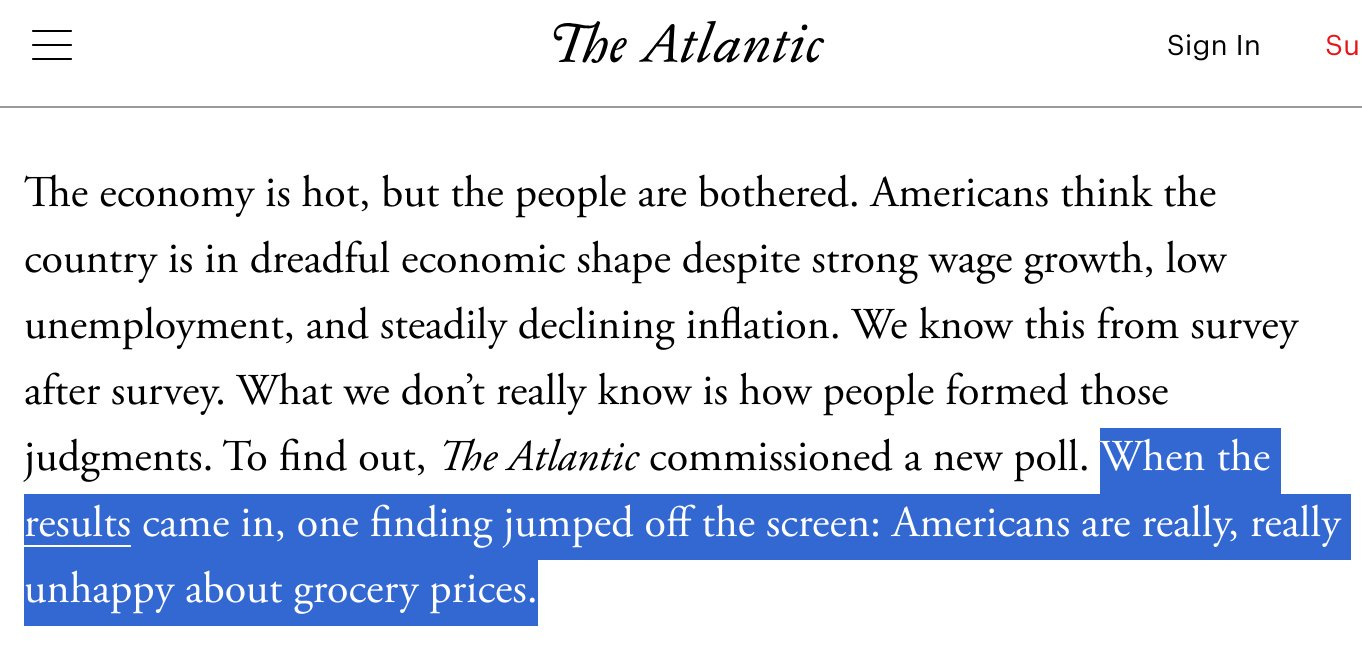
why is US consumer sentiment still negative survey after survey, turns out Grocery price is the main source of gripe ( this should be very clear to everyone except for those in capitol hill, survey, academics, economist , also collectively known as the political swamp/Ivory tower wonks )
And this is merely half the source of the of crux of the problem, the other half being housing affordability, which I will cover more by this week ( or tomorrow if time permits )
Bitcoin
According to the foremost Global Liquidity Expert, Bitcoin ( bitcoin only, other cryptocurrency has not been tested, which has lesser datapoint than Bitcoin) track the Global Liquidity relatively closely, lagging only by about 6 weeks, it display the quickest responsiveness to changes in liquidity conditions. No other instruments come close to it in terms of liquidity sensitivities. And this is why I dedicate a section to Bitcoin ( I look at it daily even when I am not writing any new blog entry )
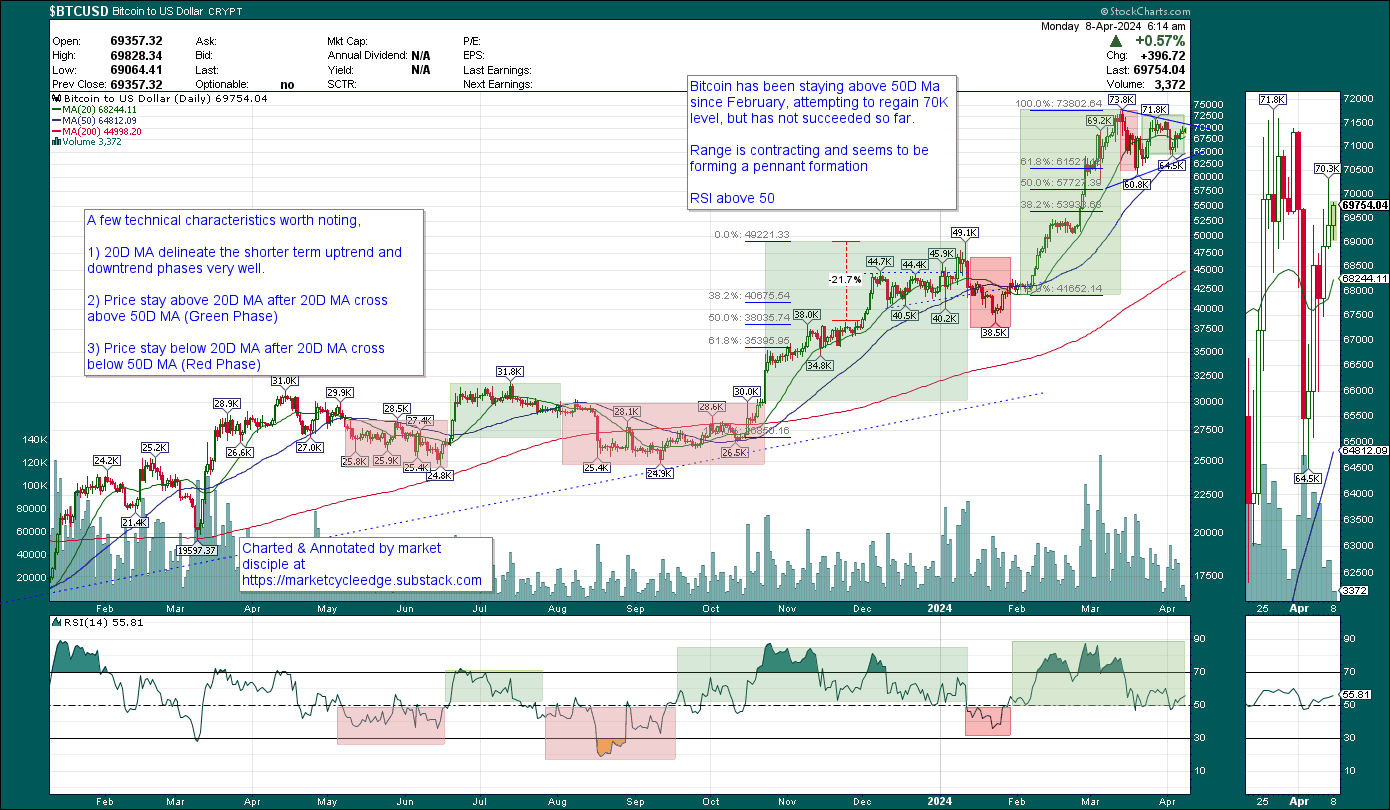
We are less than 14 days from Bitcoin halving event, and technical picture has been quite solid.
Bitcoin is attempting to regain 70K level, but has not succeeded so far.
Price is above 50D Ma since February,
Range is contracting and seems to be forming a pennant formation
RSI above 50
As always, we will continue to monitor the charts, assess the bullish/bearish evidence day-by-day to make appropriate capital allocation and investment decisions on all time frame ( short, mid & long term )
Disclaimer : The information presented here are for research and education purpose only, and does not constitute investment advice, trading recommendation, author shall not liable for any action taken by any individual/company with regards to the information presented here or any part of the website - https://marketcycleedge.substack.com/
The views expressed on this website represent the current, good faith views of the authors at the time of publication. Please be aware that these views are subject to change at any time and without notice of any kind. Marketcycleedge.substack.com and its author assumes no duty and does not undertake to update these views or any forward-looking statements, which are subject to numerous assumptions, risks, and uncertainties, which change over time. All material presented herein is believed to be reliable, but we cannot attest to its accuracy. The information contained herein (including historical prices or values) has been obtained from sources that marketcycleedge.substack.com and its author considers to be reliable; however, marketcycleedge.substack.com and its author makes no representation as to, or accepts any responsibility or liability for, the accuracy or completeness of the information contained herein, or any decision or action taken by you or any third party in reliance upon the data. All traders and investors are urged to check with Financial advisors before making any trading /investment decision.