
US stock market review - December 28th 2021
US stock market review - December 28th 2021

As mentioned in previous article, it’s an important 2-week period in the market, I will be posting market review every 1-3 day for till end of next week. In terms of yesterday performance (Dec 28th, 2021), S&P 500 -0.1% , Nasdaq composite -0.56%, Nasdaq 100 -0.48%,
let’s take a look at daily market internal statistics

Data point 1 : Market internals daily statistics 28.12.2021
NYSE Advancer/Decliner: 1610 vs 1744
Nasdaq Advancer/Decliner: 1622 vs 3053
NYSE Up volume vs Down volume : 253 Million vs 303 million
Nasdaq Up volume vs Down volume : 1115 Million vs 2443 million
NYSE TRIN : 1.34 Nasdaq TRIN : 1.16
So, under the hood, there are slightly more selling pressure than buying pressure
TRIN definition :
The TRIN will read under 1.0 when advancing stocks are the major source of volume and above 1.0 when declining stocks are the predominant source of volume flow in the market.
Now let’s take a look at SPX sector performance.

S&P500 Sector performance dated 28.12.2021
Defensive sectors , Utilities XLU( +0.9%), Staples XLP(+0.57%) are leading , this is what we don’t want to see.
Now’s lets take a look at the Utilities (XLU) and staples(XLP) charts
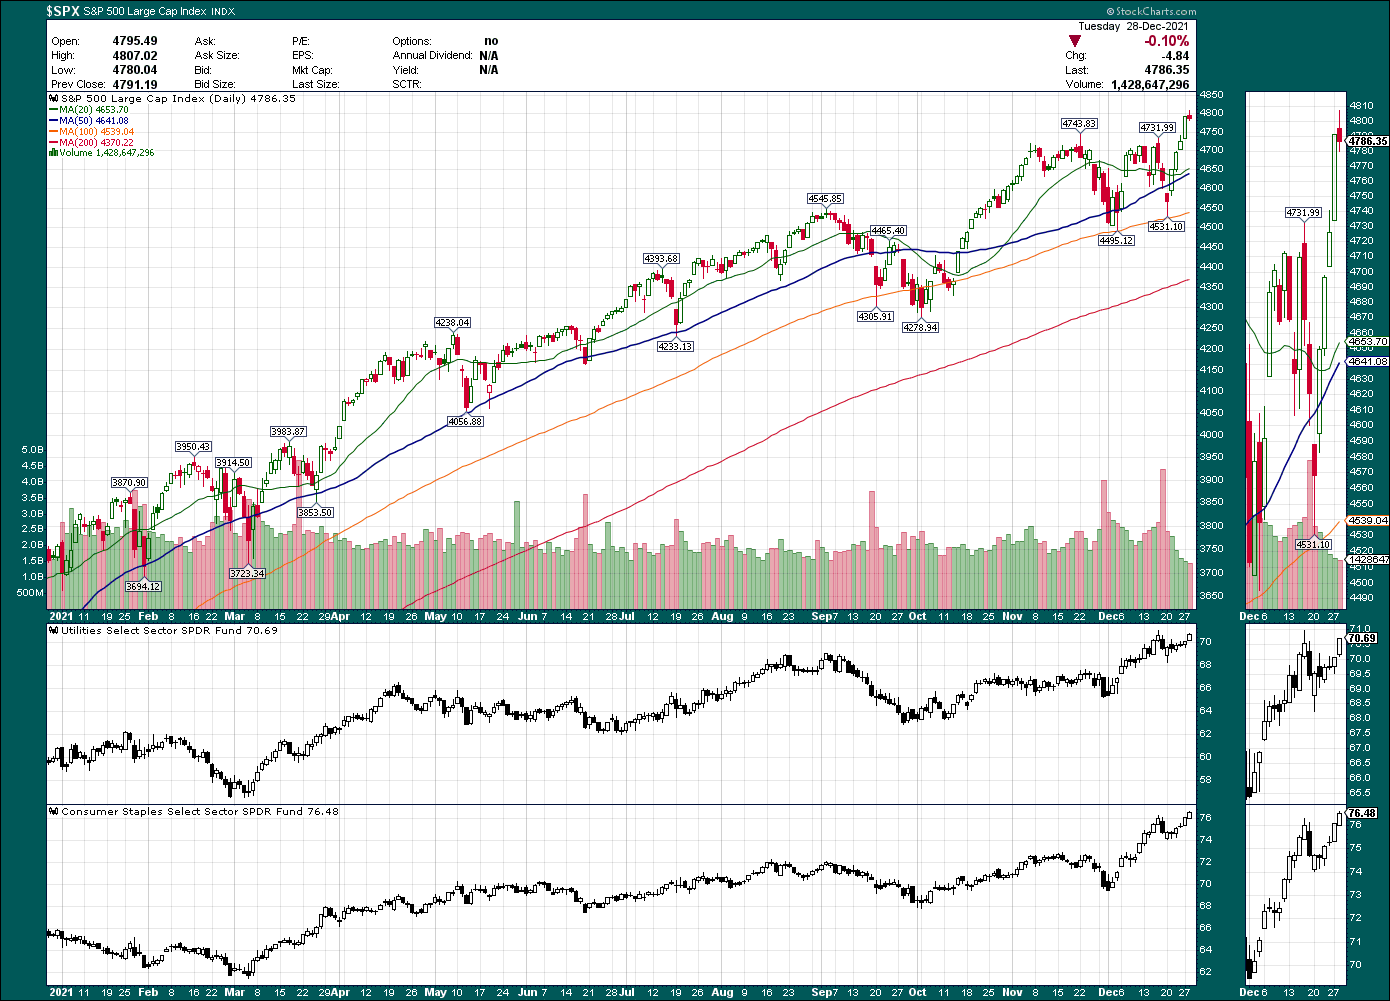
Data point 2 : SPX – XLU XLP
It should not be making a higher high, if it continually makes higher high then it’s a cause for concern ( it’s one of several data point to consider )
Now let’s take a look high yield stock
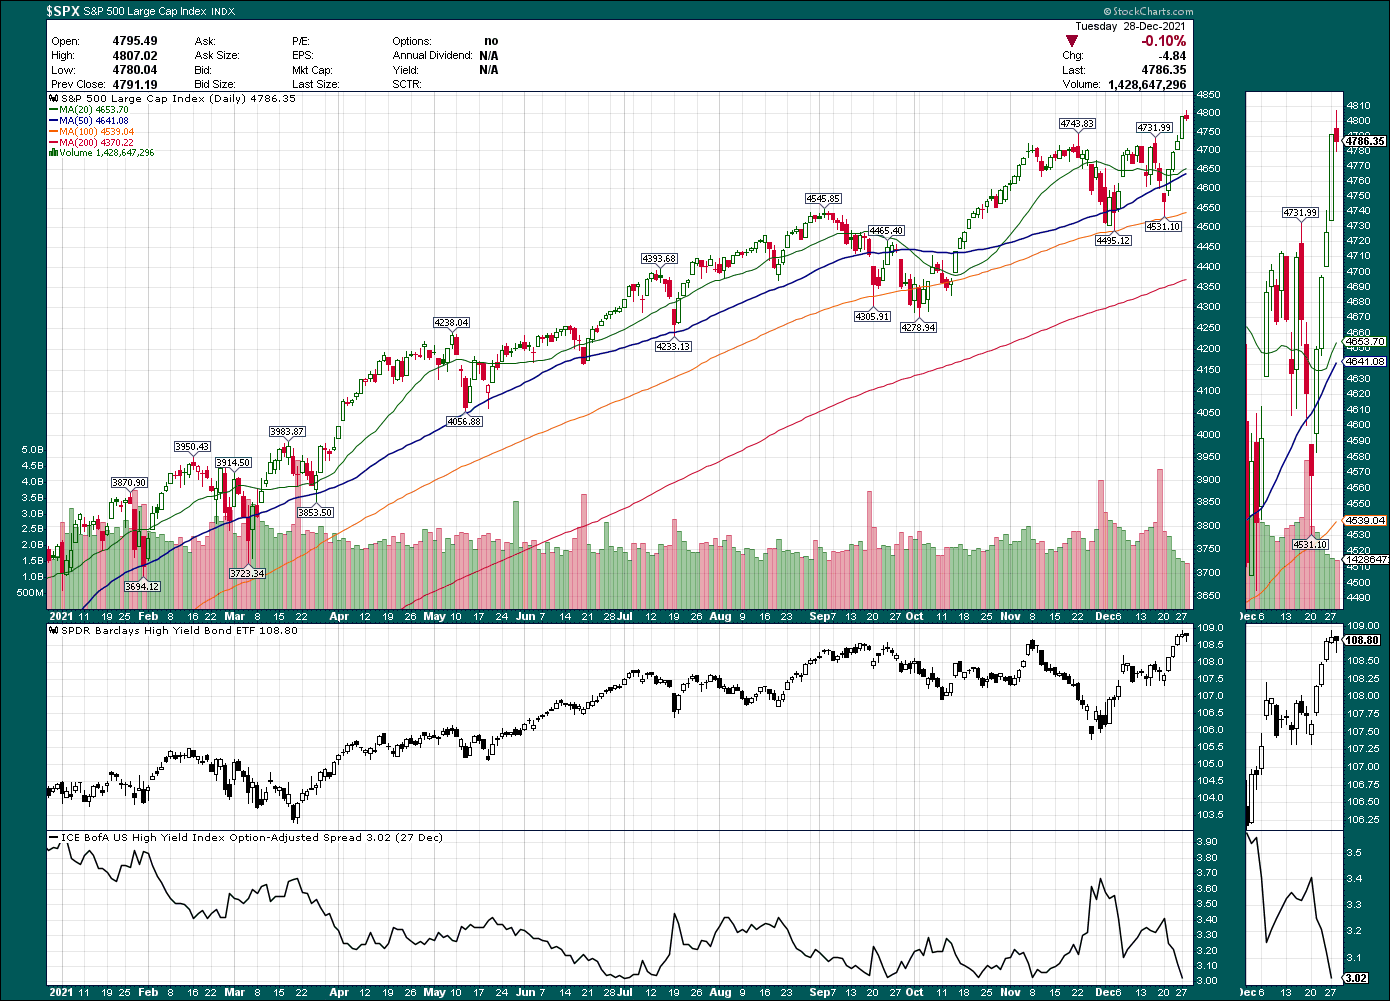
Data point 3 : SPX – high yield bond ETF, BofA high yield options adjusted spread
This shows investor appetite for riskier asset, high yield(junk) bond ETF still remain at close to highest level, investor do not sense any imminent danger and is comfortable buying them. In particular, bottom graph shows the measure of credit stress - ICE BofA high yield options adjusted spread collapse to low - it measures all ratings category bond (all the safe & risky corporate bond, but riskier than treasury bond) vs treasury curve ( safest treasury)
Now let’s a take a look at put/call ratio and VIX
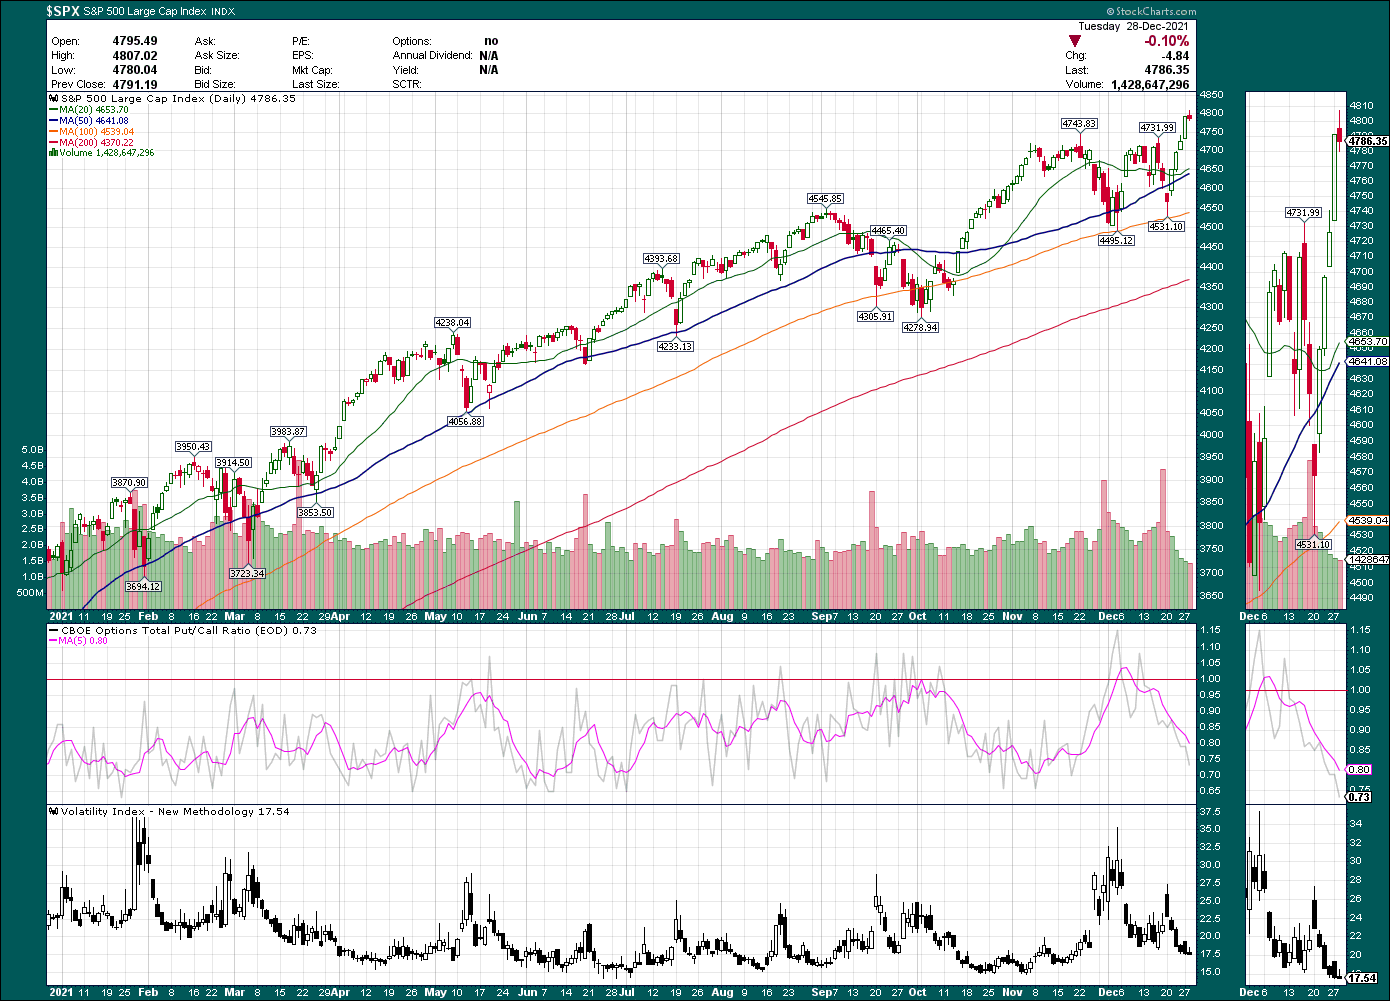
Data point 4 : SPX – Put/Call ratio and VIX
Put / Call ratio is going down continuously, VIX is also marginally lower, because investors feel safer and do not need to put to hedge against drop in their ETF/Stock portfolio.
So there you go, we have 2 positive data point for and 2 negative data point against the market. Market will always throw curve ball at you, and it’s a evolving landscape with not-so-clear-cut puzzles. So we will have to see the performance in the next few days. By end of January 4th after US market close, we will know the first important indicator that predict with very high probability - 2022 US stock market index closing year end performance (next 7 trading days post Christmas Period, also known as Santa Claus rally if market does rally in this 7 days period)
Personally, I still believe we will see a higher closing on Friday. But if I am wrong, we will have learn something new. Furthermore, if market really goes down in this 2 week period, it’s a great period for investor to buy index ETF/stock at lower level in the coming year 2022, because this is a multi year bull run till 2029 ( as predicted by Fundstrat Tom Lee, S&P 500 could rise to 12,642 or as high as 19,349 , by around 2029)
If you like what you read, pls click the like button, share it to your social media page, and subscribe to my email list to know the latest development in the market. ( Your email will be kept 100% strictly confidential and remain with my site only, no click-bait/spammy/fear-mongering article, only the best quality research for you! )
Disclaimer : The information presented here are for research and education purpose only, and does not constitute investment advice, trading recommendation, author shall not liable for any action taken by any individual/company with regards to the information presented here or any part of the website -
https://marketcycleedge.substack.com/
https://figureoutmarket.substack.com/