State of market post Dec 11, 2024 CPI release ( Nasdaq 100 All time high, market breadth retreats , Sentiment is very Bullish )
Lately, with the NDX and SPX hitting new all-time highs and the overwhelming euphoria in the air, I've been wondering how long this rally will last. Even the last remaining bear, David Rosenberg, has thrown in the towel, leaving me anxiously biting my nails, wondering whether it's time to trim my positions.
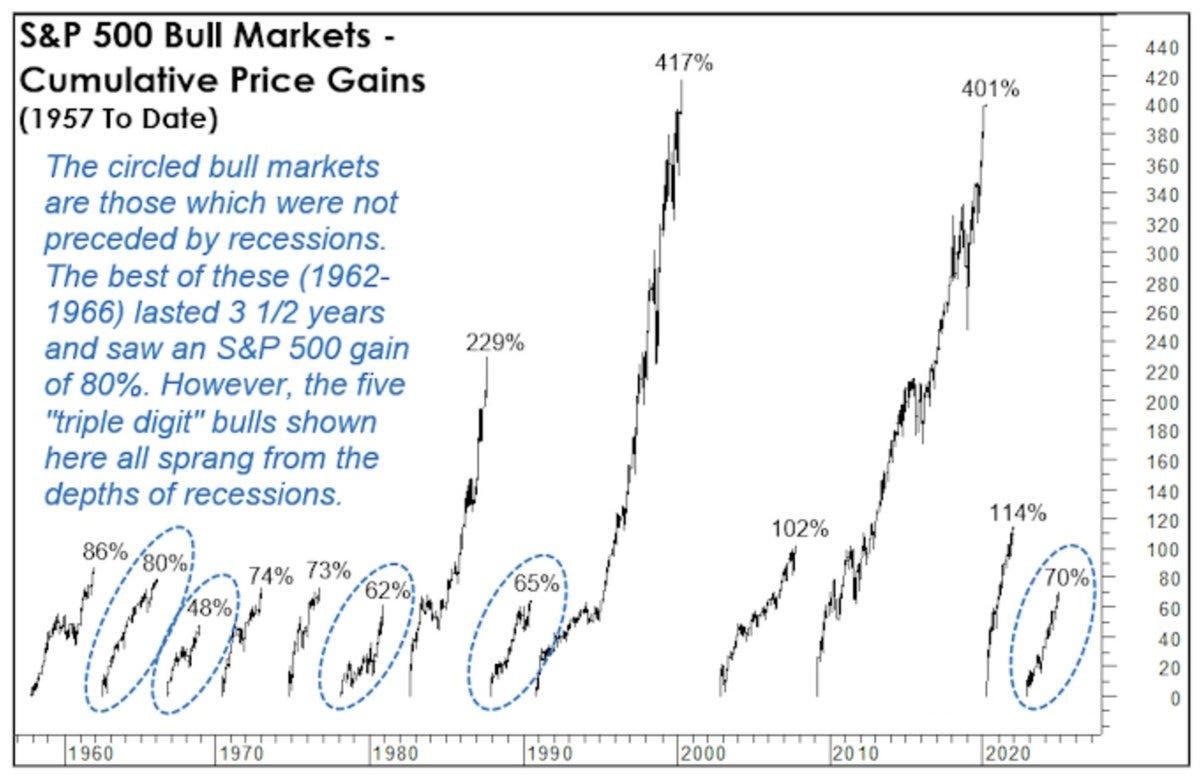
I recently came across a chart that compares bull market gains, both with and without recessions. Interestingly, bull markets without a recession tend to see double-digit gains (as highlighted in the chart below, marked by the blue circle).
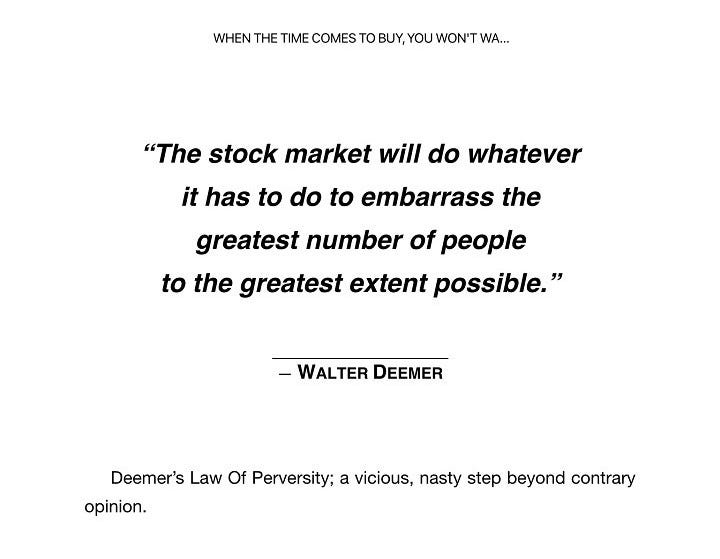
But then again, I constantly remind myself of the wisdom from a famous retired institutional analyst: the market will always do whatever it can to embarrass the greatest number of people, to the greatest extent possible. All I can do is view the market as a puzzle, with pieces that both align with past cycles and include unique idiosyncrasies that defy history.
To solve the ever evolving market puzzle, we have to tune out the noise and focus on the signal-to-noise ratio. Flow and positioning data, along with sector-relative performance, are excellent tools to help with this. I’m grateful to have access to some unique and proprietary data that makes my framework more robust and resilient.
There’s always the nagging worry of whether I can sustain performance and capture additional gains, but as long as my framework can adapt to different scenarios, I’ll take it one day at a time (or, one 15-minute block at a time ?). Is the evidence pointing toward the need to raise my stakes, or is it telling me to pull back and adopt a more conservative approach?
Anyhow, many investors seem to be adopting a PARTIAL “wait and see” approach, holding their cards close to their chest as they await Federal Reserve’s next moves. The next Fed meeting and fresh economic indicators will likely be the catalysts that drive the next phase of the market. Will the data suggest more rate cut, or lesser rate cut? The uncertainty surrounding this is keeping many on the sidelines, hesitant to make big moves until the picture (new SEP projection and fed chair Powell press tone ) becomes clearer.
OK, some of you may be wondering why I use the cap word PARTIAL, because CPI come in as expected, removing one major surprise for investors. And as a result, market has fully price in next week fed cut, 25 basis point cut is now past 90% per CME fed watch
But then again, just when you think you’ve got the market figured out, it inevitably finds a way to surprise you. That’s why I remind myself to stay humble and stay on my toes. It’s also crucial to continue exploring new data, materials, and research from other well-respected analysts.
I’ve been contemplating whether to allocate my portfolio to different sectors, but in the end, I decided to take an extra step to refine my risk-on, risk-off trigger process within the existing portfolio.
Now, let’s dive into the market review section.
Broad market overview
Ever since Nasdaq 100 broke above 21000 on December 2nd, it has been trending upwards relentlessly. Large Cap Weighted indices outperform small& mid cap, Equal-weighted counterpart.
S&P 500 11 sectors overview
Discretionary, communications continue to show impressive gain recently. We need other sectors to pick up the baton and start showing gains to sustain the bullmarket, in particular, Financials and industrials, amidst the collapse in breadth for the past few days.
MOVE index
Move index is currently at 82.40, bond price implied volatility is expected to be around 8.24% per annum.
Lower MOVE points to (implied) lower bond market volatility going forward. Bond volatility moving lower translates into less haircut to bond, in which more liquidity can be extracted from the collateral pool.
Summary of Market situation
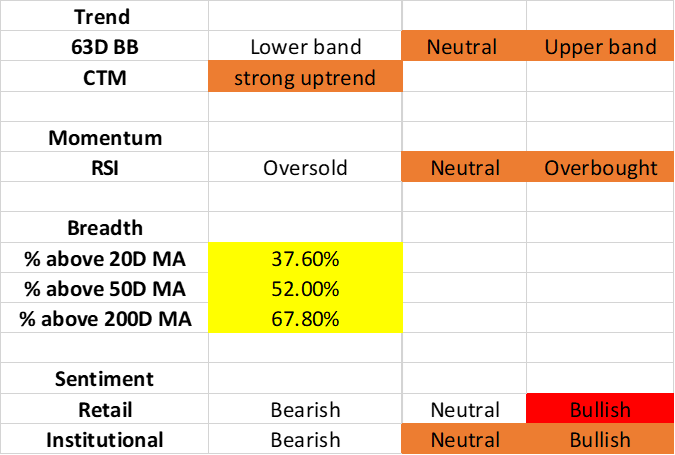
Trend and Momentum Section
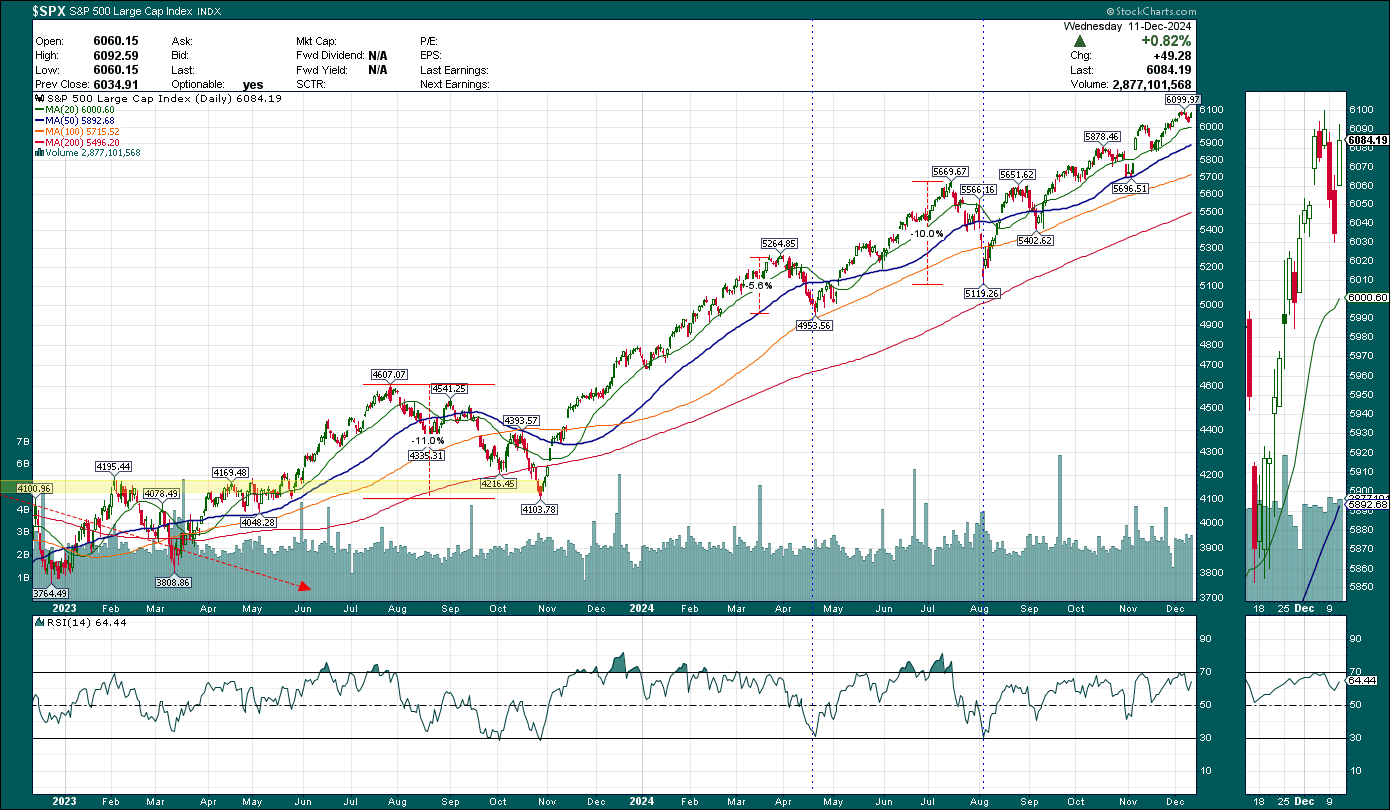
SPX
NDX
Market breadth section
% of SPX stocks above 20D 50D 200D moving average
SPX retrace from ATH while breadth drop significantly
% of SPX stock above 20D MA : 37.6%
% of SPX stock above 50Day MA : 52.0%
% of SPX stock above 200Day MA : 67.8%
NYSE & Nasdaq market internals
There are more Advancer than Decliner, and at decent volume.
On Dec 11 2024 trading session,
1.14 to 1 NYSE Advancer to Decliner ratio (1480/1299 )
1.13 to 1 Nasdaq Advancer to Decliner ratio (2285/2029 )
Sentiment
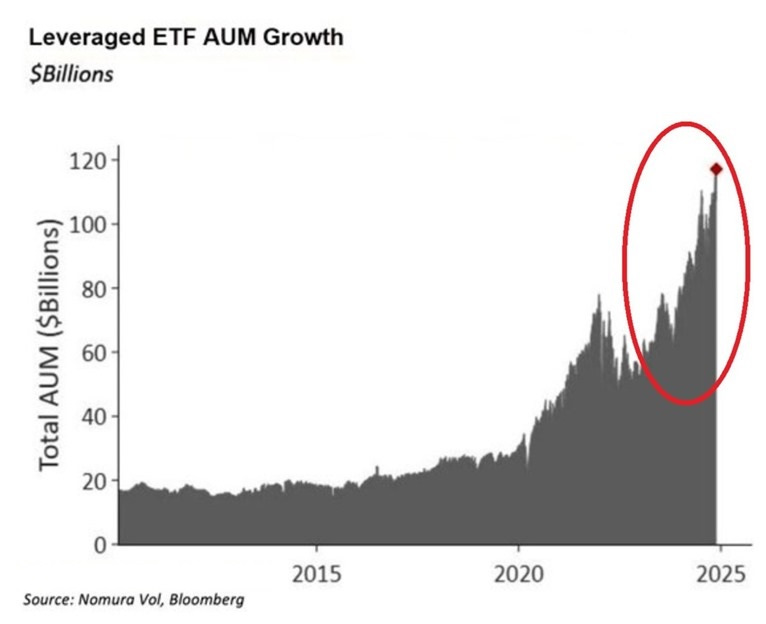
It’s extremely bullish, bordering on Mania on the retail side, as evidence by the growth in Leverage ETF AUM
As for institutional side, the sentiment is extremely bullish as well, per Goldman Sachs
Will this bullishness topple the cart? Eventually, it will—but the devil is in the details. The tricky part is figuring out the timing. It's an ever-evolving field that requires astute judgment. It's no easy feat, but that's exactly what makes it the pursuit of my next challenge—a craft that demands effort, time, and wisdom to master.
As always, we will continue to monitor the charts, assess the bullish/bearish evidence day-by-day to make appropriate capital allocation and investment decisions on all time frame ( short, mid & long term )
Disclaimer : The information presented here are for research and education purpose only, and does not constitute investment advice, trading recommendation, author shall not liable for any action taken by any individual/company with regards to the information presented here or any part of the website - https://marketcycleedge.substack.com/
The views expressed on this website represent the current, good faith views of the authors at the time of publication. Please be aware that these views are subject to change at any time and without notice of any kind. Marketcycleedge.substack.com and its author assumes no duty and does not undertake to update these views or any forward-looking statements, which are subject to numerous assumptions, risks, and uncertainties, which change over time. All material presented herein is believed to be reliable, but we cannot attest to its accuracy. The information contained herein (including historical prices or values) has been obtained from sources that marketcycleedge.substack.com and its author considers to be reliable; however, marketcycleedge.substack.com and its author makes no representation as to, or accepts any responsibility or liability for, the accuracy or completeness of the information contained herein, or any decision or action taken by you or any third party in reliance upon the data. All traders and investors are urged to check with Financial advisors before making any trading /investment decision.


