State of market before market open on Sep 16, 2024 ( S&P 500 hovering near recent swing/range high pre FOMC meeting, but is it as rosy as it looks ? )

Broad market overview
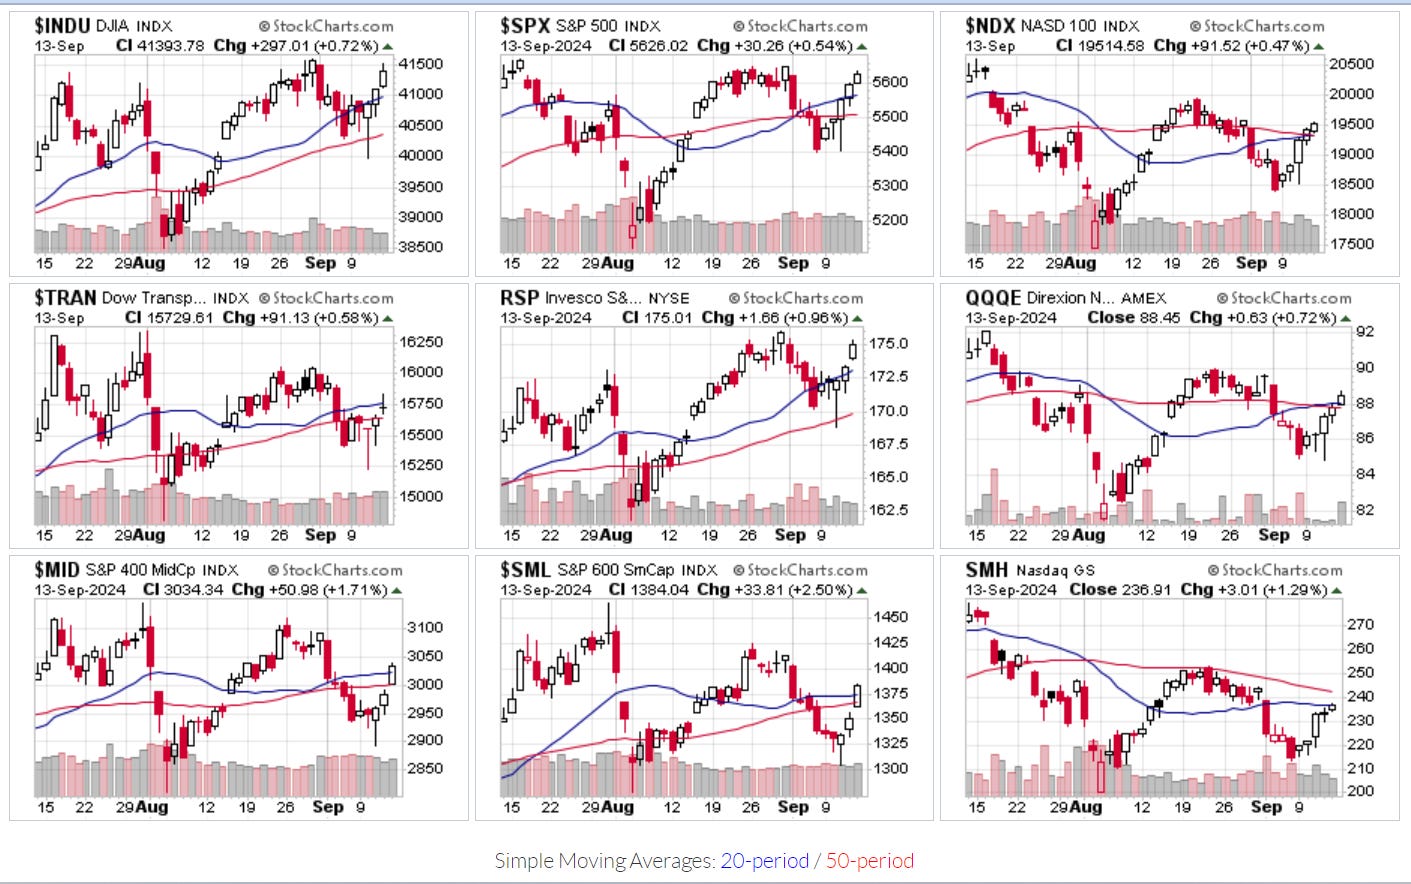
Overall, Mid and small cap, Equal weighted indices outperform cap weighted indices.
Although SPX was hovering near recent high, but the same cannot be said for other indices.
S&P 500 11 sectors overview
Utilities, industrials and Materials are the best performing sectors. While healthcare, Financials and Technology are the bottom ranking sectors.
FOMC rate decision meeting announcement at Sep 18
Market is split between 2 camp ( close to 60% for 50 basis point cut, and 40% for 25 baisis point cut ) , it’s a lose lose situation for Fed, if they do 25 basis cut, it will be they are late to the game and not responding enough. If they do a 50 basis cut, they realized they are late and is panicking…etc. To some other group, cutting in September, so close to election reeks of politically bias. It’s a sticky dilemma for which no solution can present without opening yourself to considerable downside bruise. Well, they should have cut in July, but.. nobody knows why they didn’t.
Participants will be closely watching dot plot, in particular Rate path and terminal rate, rate cut odds and yield curve adjustment will be furious. As of 16 Sep 9am Sg time / 15 Sep 9pm US eastern time. Market participants are pricing in a cut till 2.75-3.00% Fed rate by 30 July and 17 Sep 2025.
MOVE index
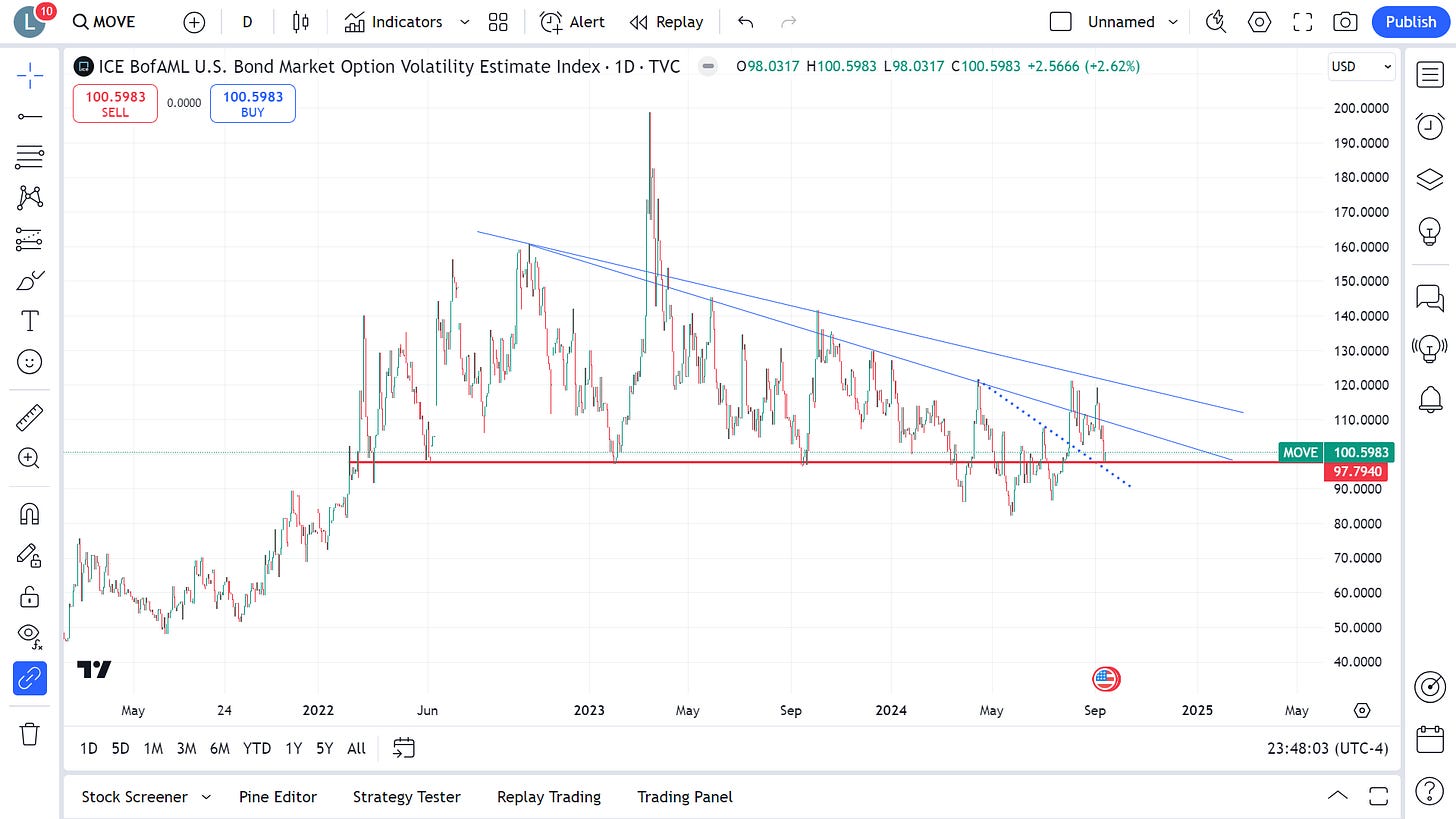
Move index is currently at 100.6, bond price implied volatility is expected to be around 10% per annum.
forward rate pricing will be adjusted quite furiously when Fed dot plot is published on Sep 18, so MOVE index is likely to be volatile, we will be monitoring it closely post Sep 18 market close, see how it fluctuate 2 - 4 week after Sep 18.
NYSE & Nasdaq market internals
There are more Advancers than Decliner. But it’s occurring at a lower volume than previous week when market was falling.
On Sep 13 2024,
5.5 to 1 NYSE Advancers to Decliner ratio (2379/433 )
3.1 to 1 Nasdaq Advancers to Decliner ratio (3200/1033 )
% of SPX stocks above 20D 50D 200D moving average
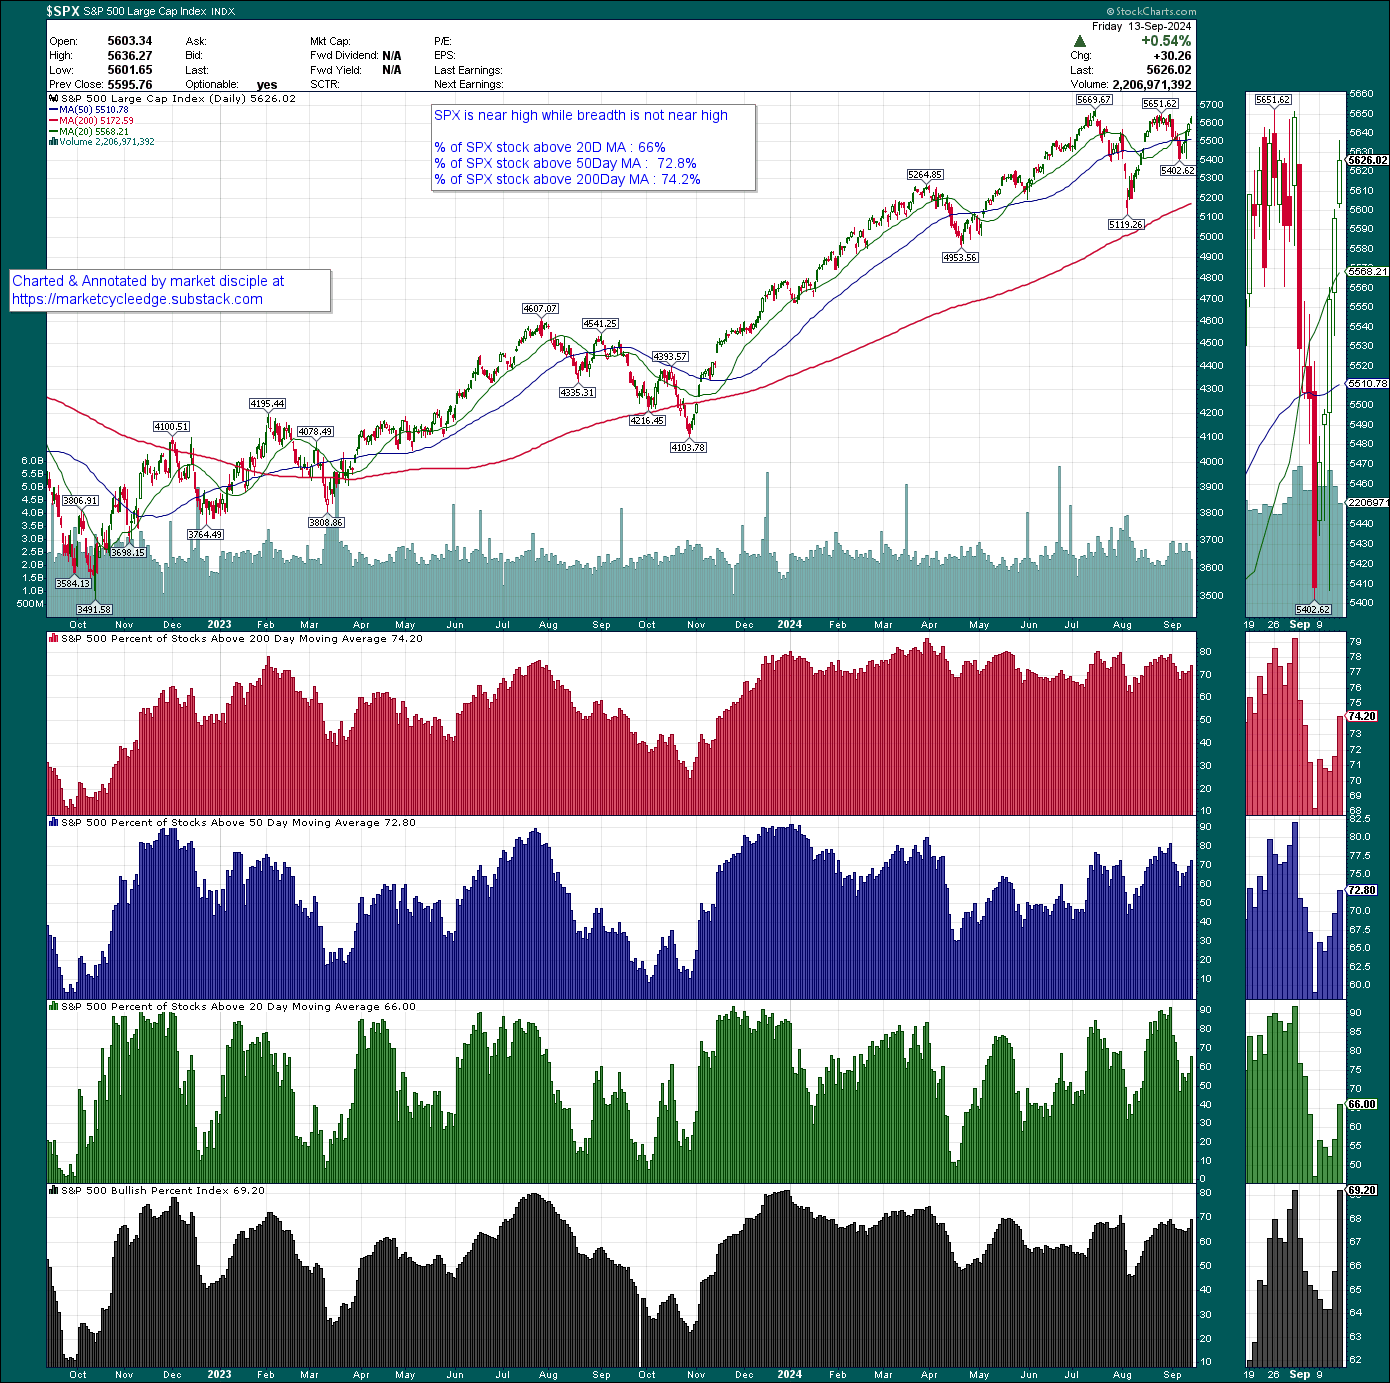
SPX is near high while breadth is not near high
% of SPX stock above 20D MA : 66%
% of SPX stock above 50Day MA : 72.8%
% of SPX stock above 200Day MA : 74.2%
Bitcoin
According to the foremost Global Liquidity Expert, Bitcoin track the Global Liquidity relatively closely, lagging only by about 6 weeks, it display the quickest responsiveness to changes in liquidity conditions.
Bitcoin daily chart
Bitcoin is still mired in consolidation, slow bleed down trend doldrums. Currently BTC is below 50D and 200D MA.
It's below 200D MA for several week, while 20D and 50D MA has been sloping down for a few weeks, definitely a cause for concern
If you would like to know more about
1) the best way to glean insights as Fed begin their rate cutting cycle
2) what are the upcoming opportunity vs risk , and actions to take for your portfolio
3) my thoughts on latest market development
then join my Paid subscription
Cost vs Benefit of joining paid subscription
For a price of USD 15 per month ( USD 0.50 per day ) or USD 149 per year (less than USD 0.42 per day ) I will give multiple big ideas per year to capitalize on biggest trends and shift in financial market to accelerate the growth of your savings / investment accounts.
That’s right, for the price USD 0.50 or less than USD 0.42 per day, you could gain 4 digit or 5 digit in USD annually with a small account if you catch any 1 of the biggest trends from my ideas & suggestions. I deliberately keep it low to make it extremely affordable and accessible for those with small savings to access high quality research, market leading indicators/charts.
The following sections are for paid subscribers
Paid subscribers will get my thoughts on the latest update in the market as the situation/development unfolds. You will also get access to higher quality indicator to get a better handle on the market, and triangulate your entry point at Buying/accumulating your 401K ETF product. Conversely, I will also share strategies and timing ideas to avoid upcoming risk and protect your portfolio should there be incoming market risk in the near term horizon.


