State of market before Christmas holiday ( market stabilized while breadth is still anemic, 3 evidence for near term bottom post Fed-induced drop and 1 evidence against local bottom )
Hello and Merry Christmas to everyone.
Undoubtedly the question in everyone mind is, has the market bottom or will the market fall further. And in the spirit of holiday gift giving in Christmas, I have decided to make the following free , which otherwise would have been paywall article during other time.
Could I be wrong ? would market fall further ? yes absolutely, we can’t rule out anything in the market, it could possibly fall further. But is continuation of falling a likely outcome? It’s unlikely based on current technical sign,
Allow me to present the evidence for near term market bottom, ( not a lasting bottom, but good enough for local bottom lasting 2 – 3 weeks at the very minimum or until market throw a cake on your face )
3 evidence suggesting market local bottom,
Evidence 1: breadth capitulation
Oversold capitulation indication
1)NYSE common stock only 22 decliner to 1 Advancer @ 18 Dec , pink dotted line
2)Made a stand at around 50D - 65D MA
3)Rebound at higher volume @ 20 Dec, blue dotted line ( although volume signal is somewhat skewed by Op-Ex day )
Evidence 2 : 8% SPX stock above 20D MA
To be exact, 7.8% of SPX stock above 20D MA is a indicative sign for local bottom in stock market
Evidence 3 : Market made a stand at important Fibonacci level
Evidence 3A SPX stabilized and rebound at important Fibonacci level
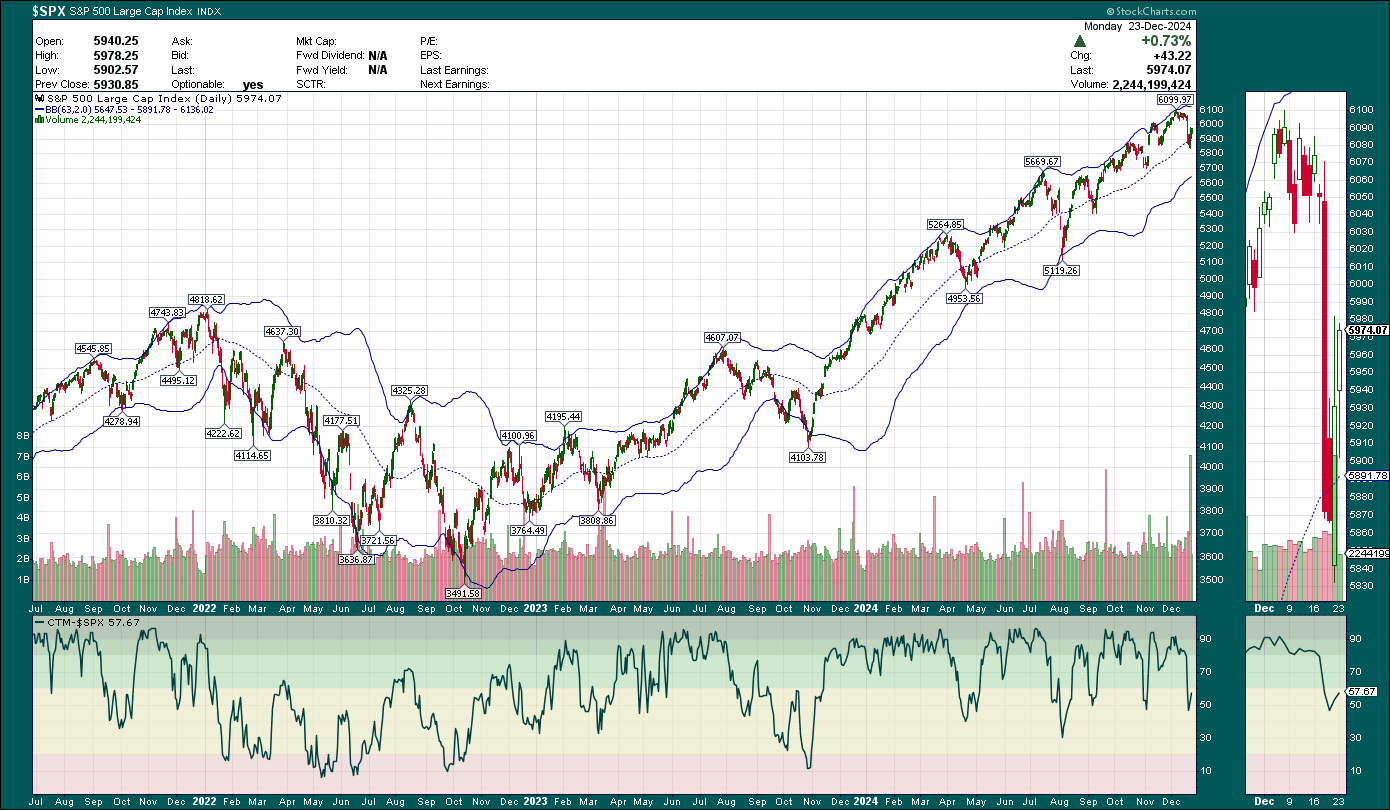
SPX defended the 61.8 % Fibonacci level from Early November swing low to recent swing high ( 6090++ ) . SPX subsequently recover 50% of Fibonacci level from recent swing high ( 6090++ ) to Dec 19 swing low (5830).
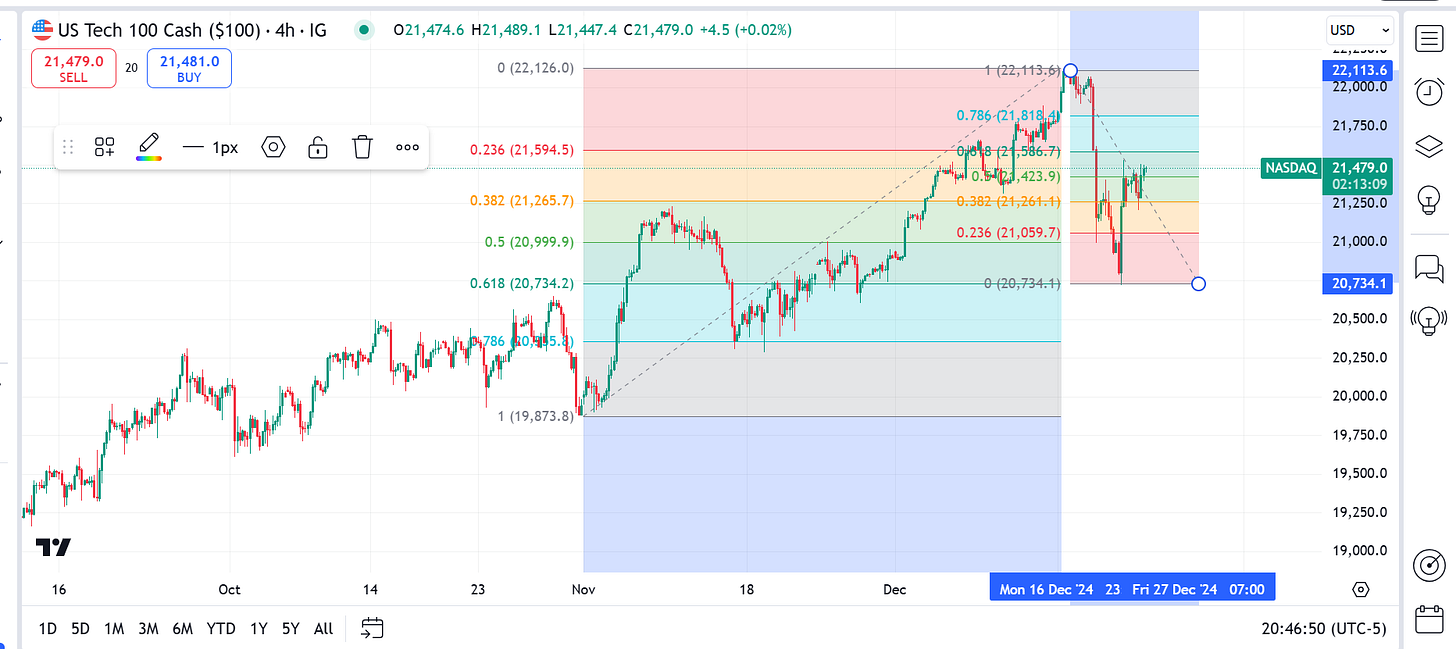
Evidence 3B NDX stabilized and rebound at important Fibonacci level
NDX defended the 61.8 % Fibonacci level from Early November swing low to recent swing high ( 22.1K ) . NDX subsequently recover 50% of Fibonacci level from recent swing high ( 22.1K ) to Dec 19 swing low (20.8K).
1 evidence against local bottom
10Y yield has broken down trendline starting from end oct 2023 swing high, this is something to watch in the coming, 10Y yield need to top out for market to sustain the bull run.
if JNK cross and stay above 50D MA, it’s a plus point for the market
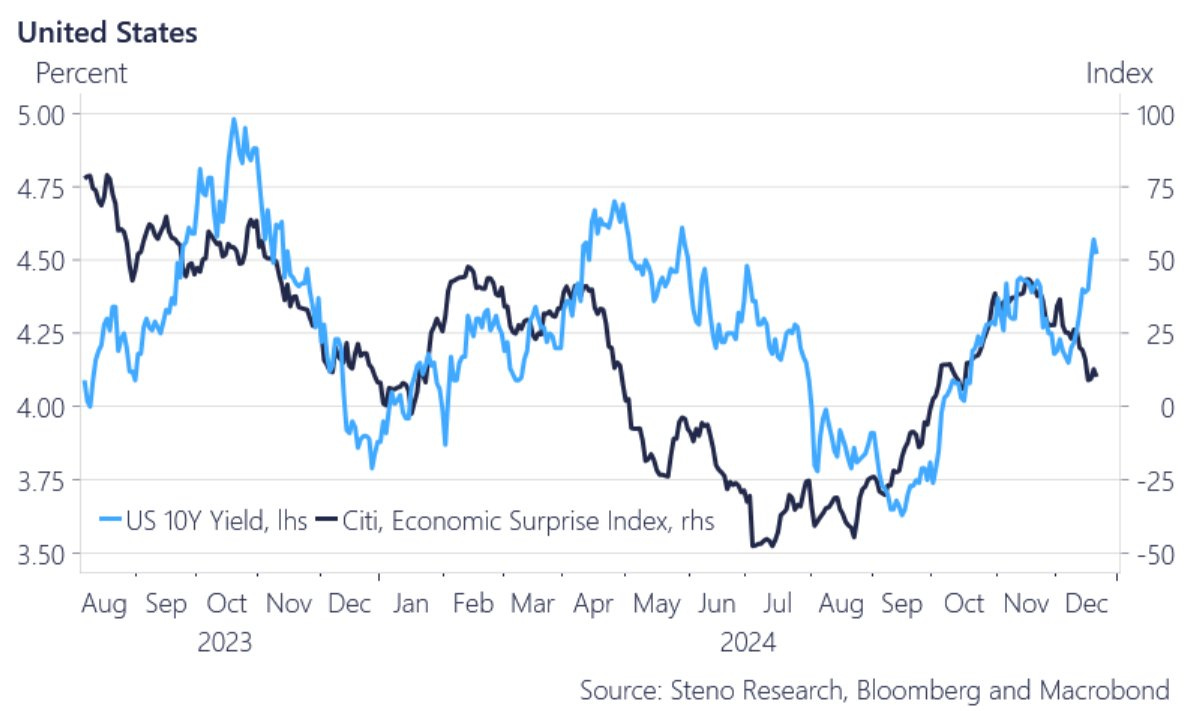
But if we look at the following charts, Economic surprise has been surprised to the downside for several months, and a jaw has open up between 10 Year yield and economic surprise index. Normally both 10year yield and economic surprise has positive correlation.
Also, market fell because of higher inflation, and lesser rate cut in Federal reserve SEP forecast.
According to Fed chair Powell, Higher inflation in SEP forecast were attributed to the following 2 reasons,
1) higher inflation data in September, October, ( in other words, inflation did not come down as fast as expectation )
2) Some people did take a very preliminary step and start to incorporate highly conditional estimates of economic effects of policies into their forecast at this meeting and said so in the meeting. Some people said they didn't do so, and some people didn't say whether they did or not. So, we have a people making a bunch of different approaches to that. But some did identify policy uncertainty as one of the reasons for their writing down more uncertainty around inflation.
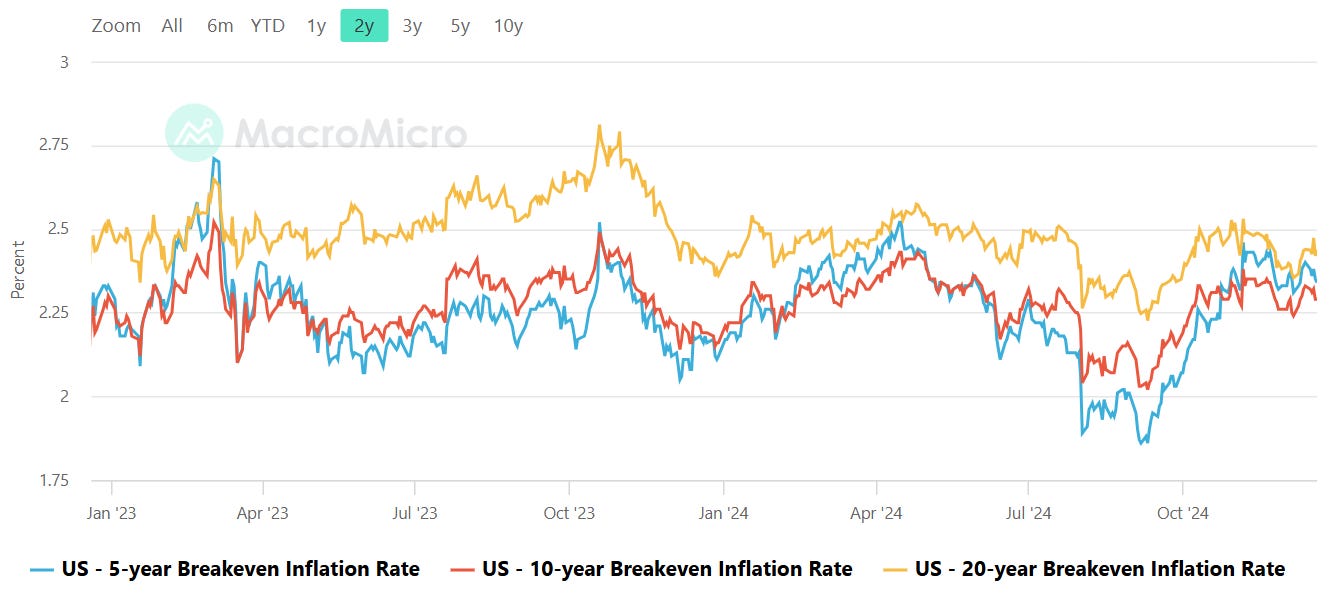
Does market buy the higher inflation story from Fed, according to breakeven inflation data post fed , so far the answer is NO
Now, let’s dive into the usual market review section.
Broad market overview
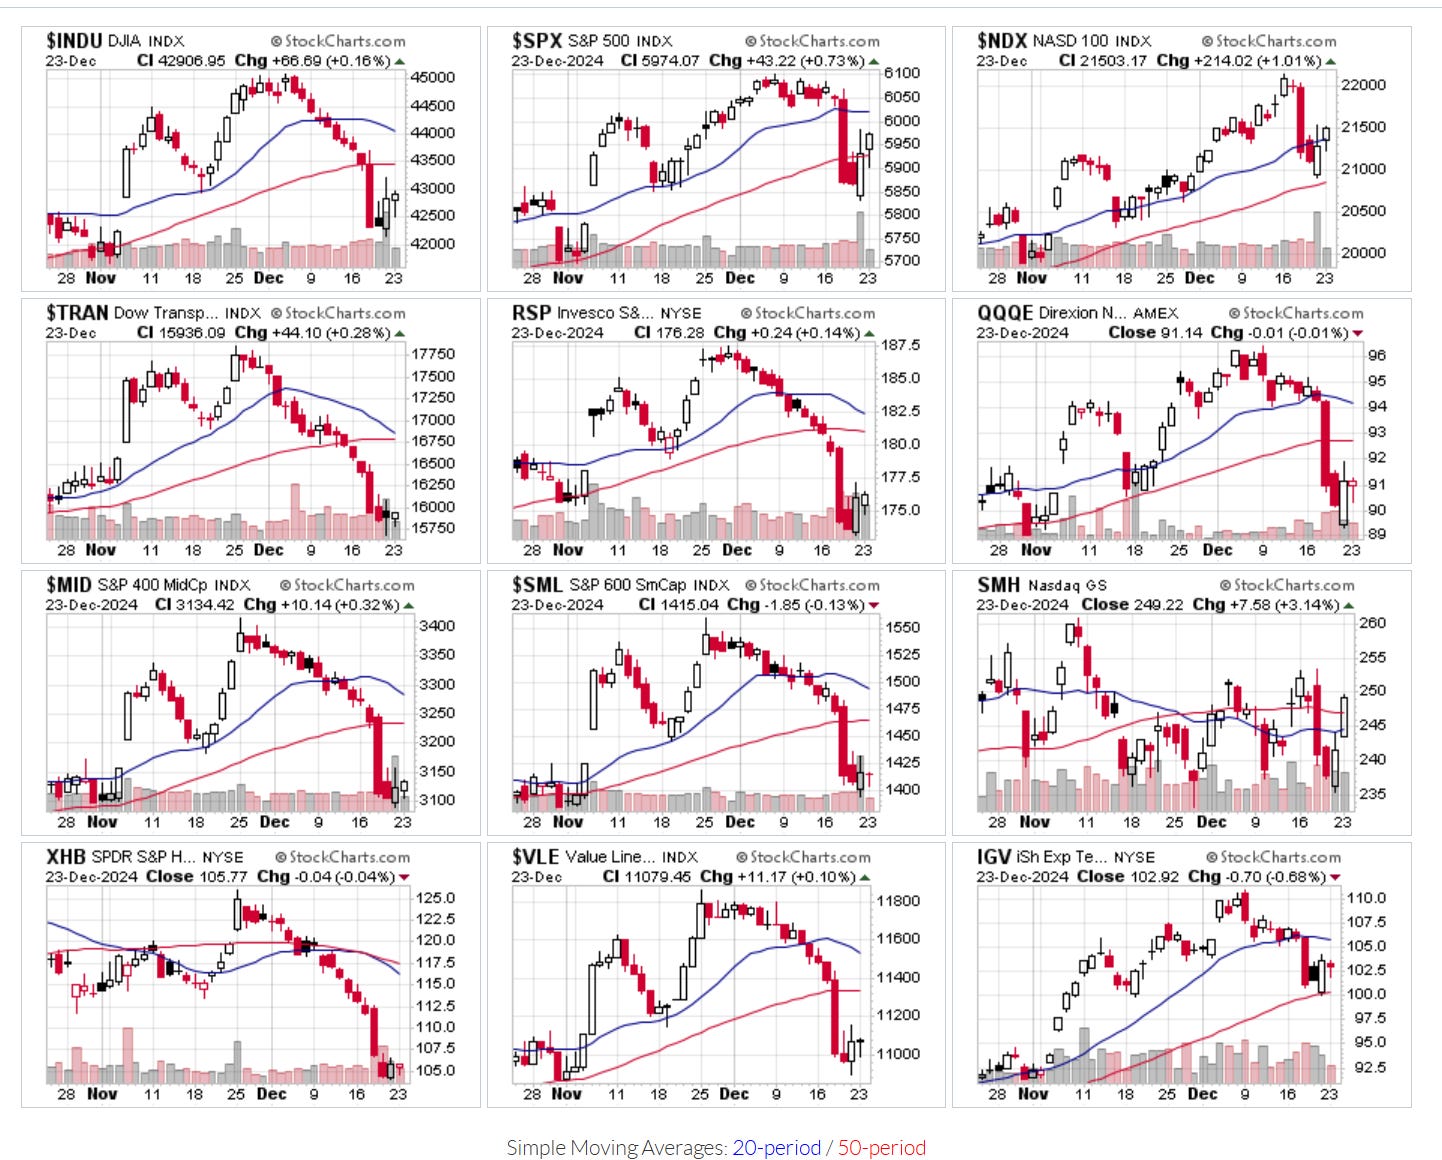
Large cap ( skewed by technologies ) and semi rebound and regain half the lost ground from Dec 18, 19 plunge; while small, mid cap and equal weighted counterpart stabilize at the bottom, but still haven’t mount a significant rebound.
Large cap weighted indices outperform DJIA, Small, Mid cap and equal-weighted counterpart.
S&P 500 11 sectors overview
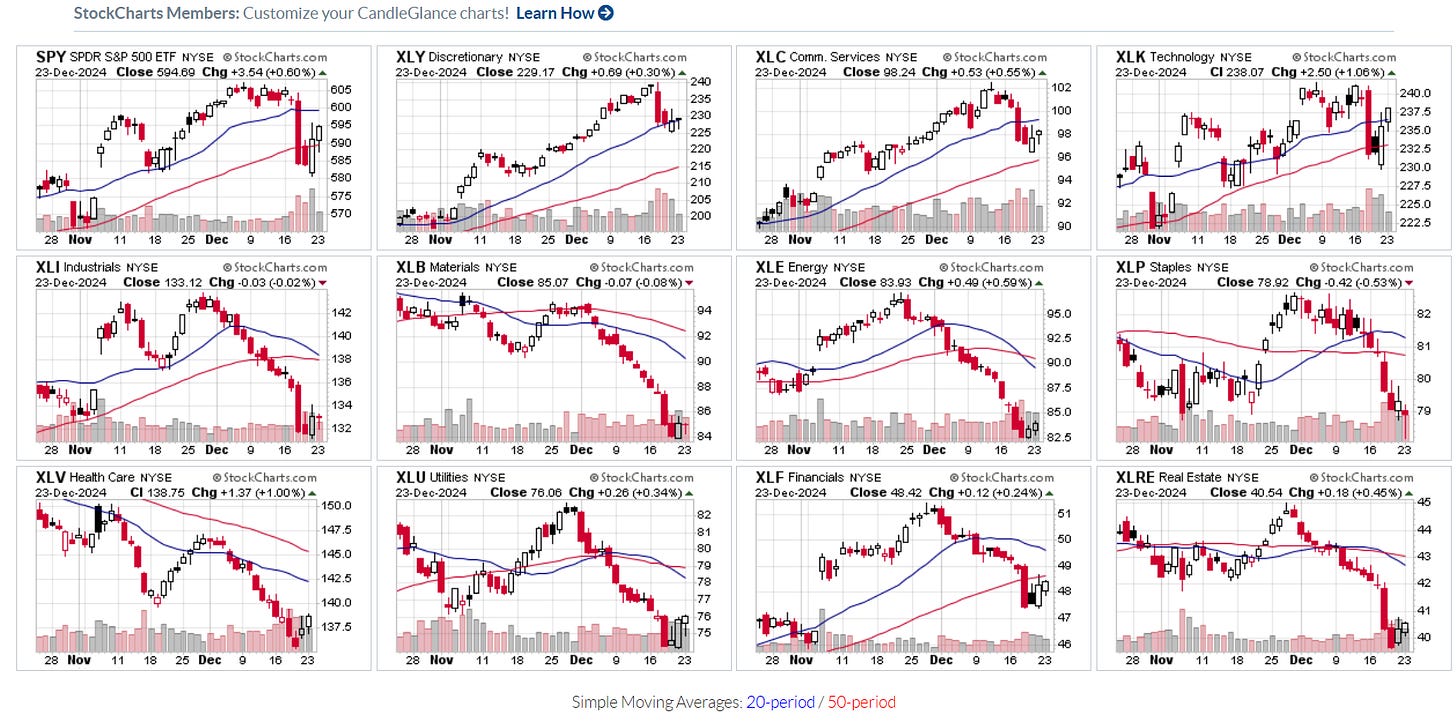
Under the hood, Technology bounce convincingly while all other sectors are still stabilizing without any semblance of rebound.
MOVE index
Move index is currently at 95.84, bond price implied volatility is expected to be around 9.6% per annum.
Lower MOVE index points to (implied) lower bond market volatility going forward. Bond volatility moving lower translates into less haircut to bond, in which more liquidity can be extracted from the collateral pool.
Summary of Market situation
Trend and Momentum Section
SPX
NDX
Just FYI , why did I choose 63 Days for Bollinger band, because institutions balance their portfolio every quarter ( 1 quarter = +/- 63 trading days )
Market breadth section
% of SPX stocks above 20D 50D 200D moving average
SPX rebound while breadth is still anemic, albeit stabilizing without further deterioration.
% of SPX stock above 20D MA : 11.8%
% of SPX stock above 50Day MA : 26.8%
% of SPX stock above 200Day MA : 57%
NYSE & Nasdaq market internals
Breadth is ok, nothing to shout about
On Dec 23 2024 trading session,
1 to 1 NYSE Decliner to Advancer ratio (1394/1385 )
1.16 to 1 Nasdaq Decliner to Advancer ratio (2333/2016 )
Sentiment
Retail sentiment has returned to a more neutral stance now. .
Institution sentiment has returned to a more neutral stance now.
As always, we will continue to monitor the charts, assess the bullish/bearish evidence day-by-day to make appropriate capital allocation and investment decisions on all time frame ( short, mid & long term )
Disclaimer : The information presented here are for research and education purpose only, and does not constitute investment advice or trading recommendation, author shall not liable for any action taken by any individual/company with regards to the information presented here or any part of the website - https://marketcycleedge.substack.com/
The views expressed on this website represent the current, good faith views of the authors at the time of publication. Please be aware that these views are subject to change at any time and without notice of any kind. Marketcycleedge.substack.com and its author assumes no duty and does not undertake to update these views or any forward-looking statements, which are subject to numerous assumptions, risks, and uncertainties, which change over time. All material presented herein is believed to be reliable, but we cannot attest to its accuracy. The information contained herein (including historical prices or values) has been obtained from sources that marketcycleedge.substack.com and its author considers to be reliable; however, marketcycleedge.substack.com and its author makes no representation as to, or accepts any responsibility or liability for, the accuracy or completeness of the information contained herein, or any decision or action taken by you or any third party in reliance upon the data. All traders and investors are urged to check with Financial advisors before making any trading /investment decision.


