
Market review 08102023 part 2 ( market breadth and sector relative performance )
Market review 08102023 part 2 ( market breadth and sector relative performance )

This is part 2 of the market review. ( for part 1 pls refer to https://marketcycleedge.substack.com/p/market-review-oct-8th-2023-sp500 )
Market gap down in the futures opening, on news of Hamas attack on Israel, is this another geopolitical spark that can bring down the market ? ( does it have enough fuel to spark a rally in crude oil market, and ignite a raging inflation, causing yield spike and stock market to drop ?)
It all depends on how crude oil and bond market/yield react to the news, &simultaneously/subsequently whether Stock market react to crude oil/yield if they both spike, I have no idea if it will happen, we will just assess the stock market again when that point materialize )
These news/events are beyond our control, all we that can control is our own analysis, entry , exit, and how much money to risk. If Hamas-Israel geopolitical issues cause crude oil price to skyrocket, and stock market to plunge to our own stop loss level, we will respect the market, and look for another entry. ( lots of people miss the rally, so entering the market at the lower level might not be so bad after all )
Lets turn our attention to sector relative performance and market breadth in last week,
Sector Relative performance
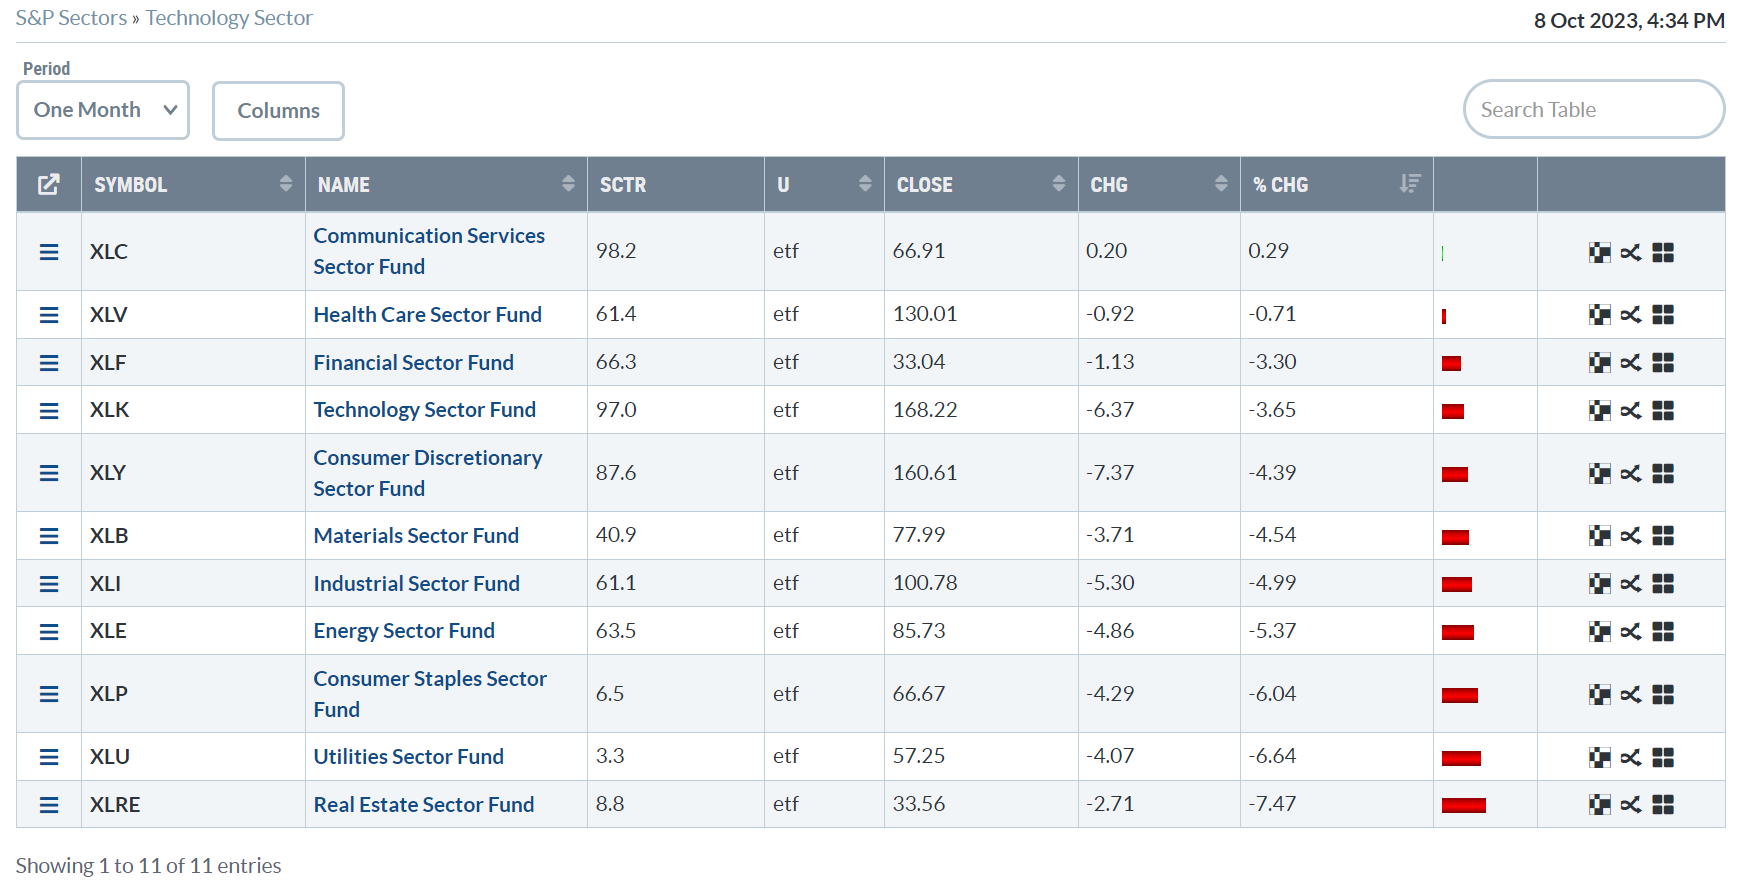
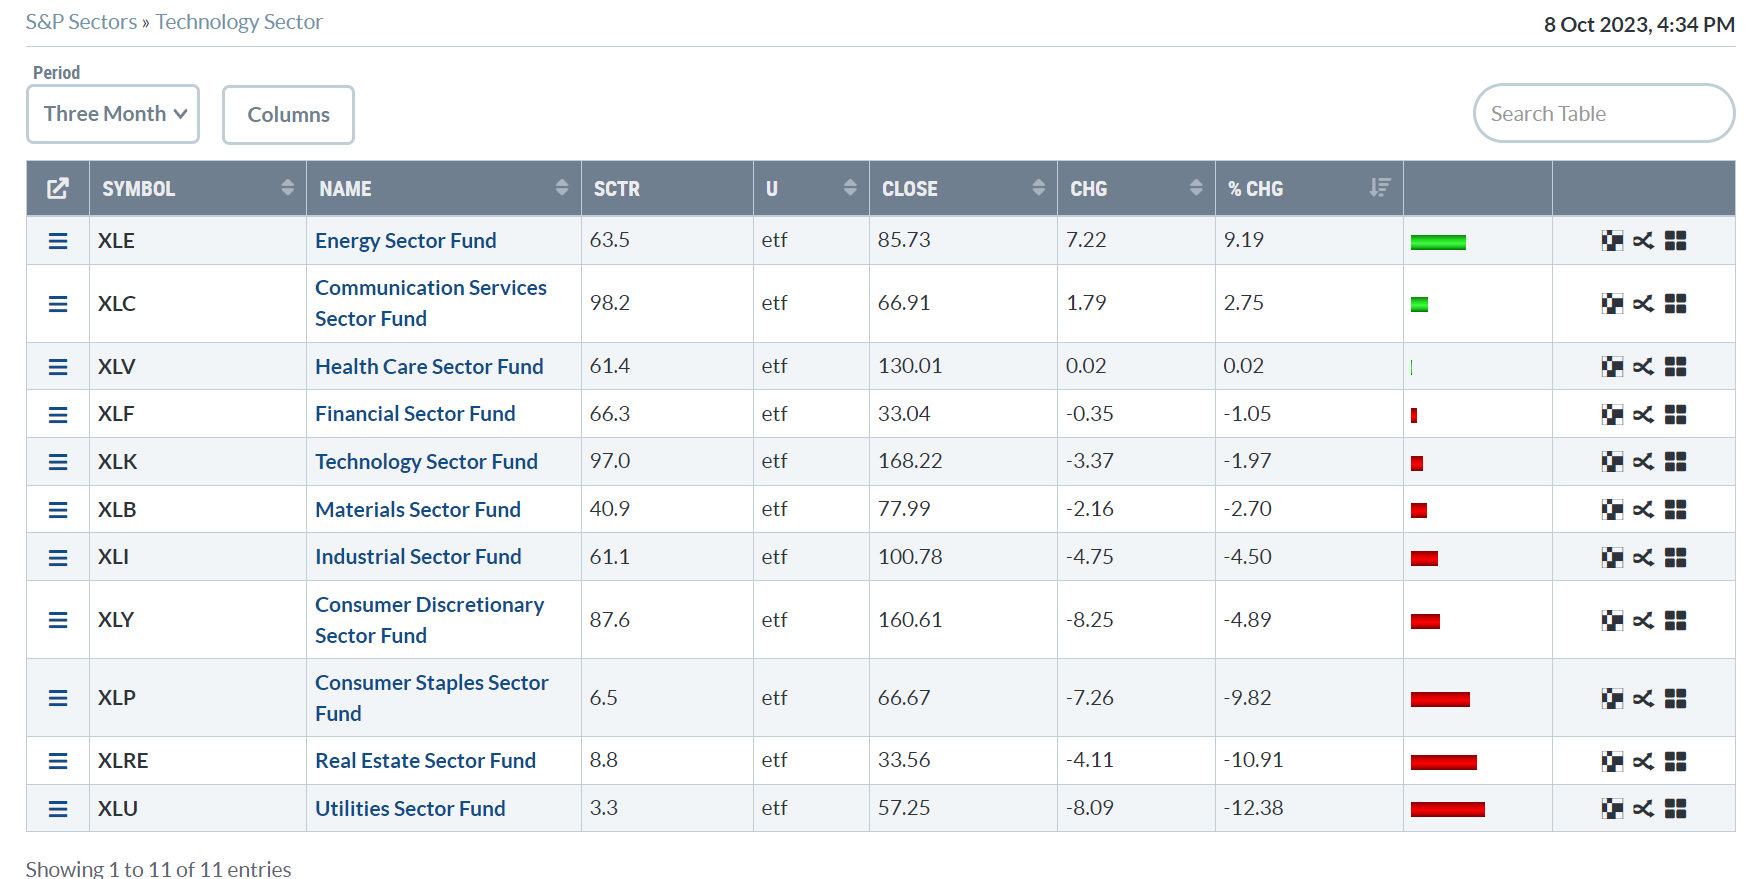
Looking at the performance of 11 sector , over the past 1 week, 1 month and 3 months timeframe, at least 1 offensive sector (Technology, Communications, Consumer discretionary ) rank the highest in performance, while Defensive sector ( Utilities, Consumer staples, real estate ) is languishing at the bottom.
S&P500 11 sector performance over 1 week

S&P500 11 sector performance over 1 month
S&P500 11 sector performance over 3 month
While the market was falling for the past 2 months, Equal weighted technologies is holding it’s own versus equal weighted S&P 500, which is quite impressive.
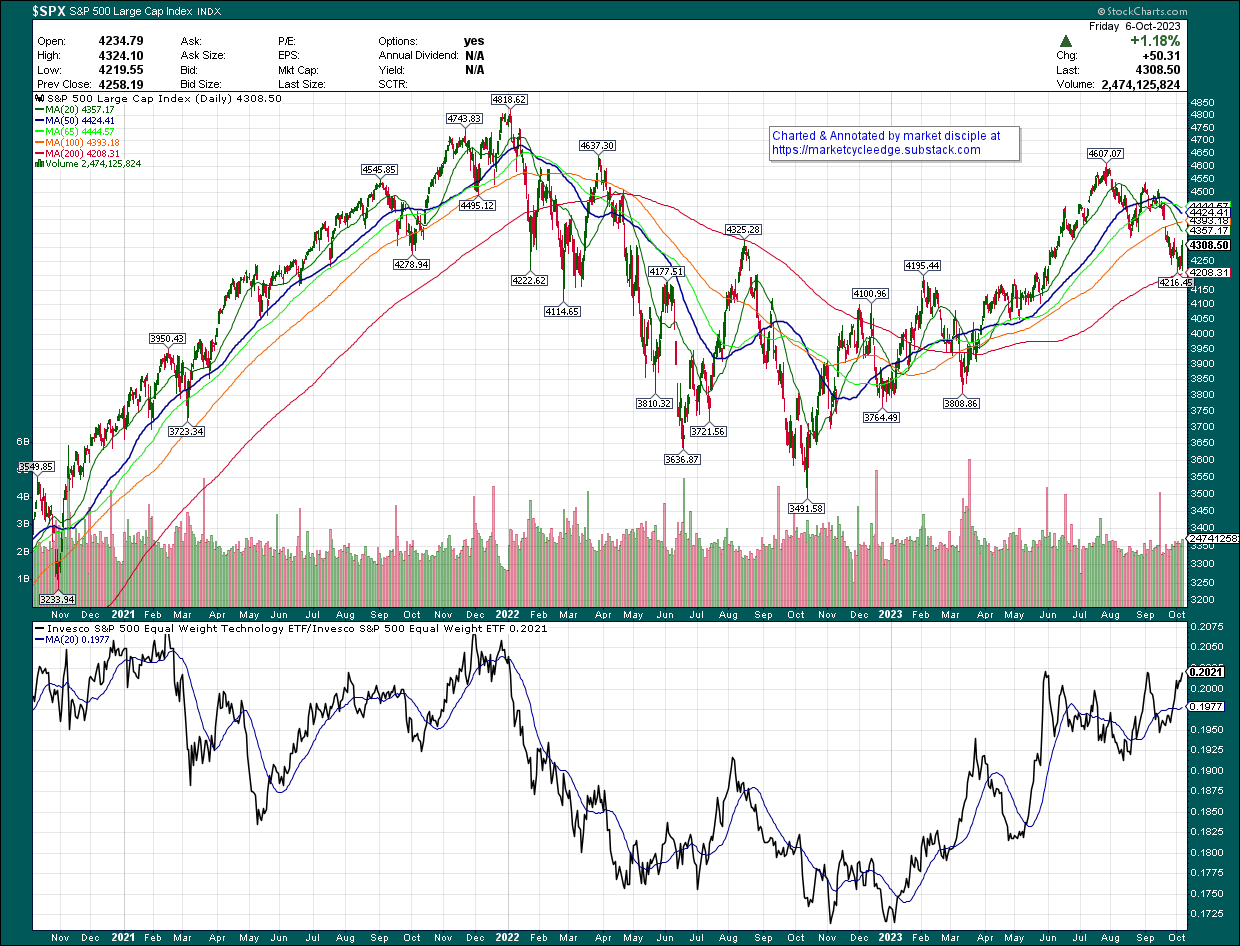
Similarly for Equal weighted consumer discretionary vs equal weighted consumer staples, the chart is holding and not breaking down like the S&P500 during the August September market unrest.

When yield curve was shooting up, all the growth stock whose future earning is supposed to be decimated by the high interest rate, correct ? well, the chart seems to point at the other way,

All the growth stock was rising relative to value stock over the Big , medium and small cap. Suggesting money rotation into growth stock when the doom & gloom news was published & recirculated in major media one after another.
Market breadth
Lets turn our attention to market breadth
McClellan Oscillator
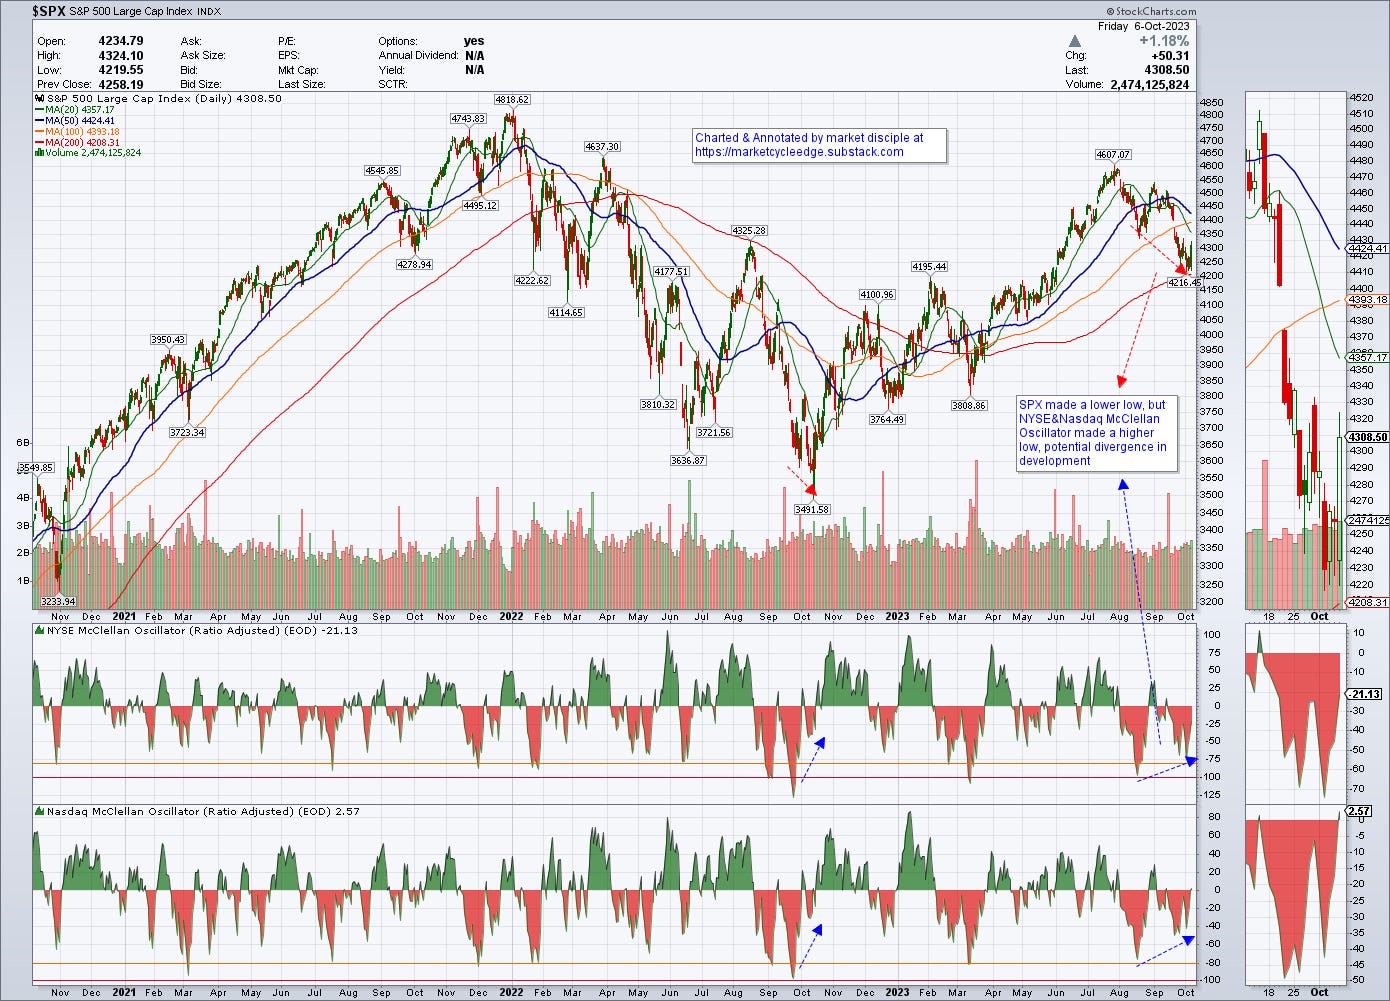
McCllelan oscillator is market breadth indicator, basically it is a MACD applied over the Advancers and decliners of NYSE / Nasdaq, to see the momentum of stock qty going up / down.
While S&P500 made a lower low in September, both NYSE and Nasdaq McClellan oscillator seems made a higher low ( a divergence ), meaning there are lesser NYSE & Nasdaq stock going down.
SPX % of stock above 50days MA, 200 days MA
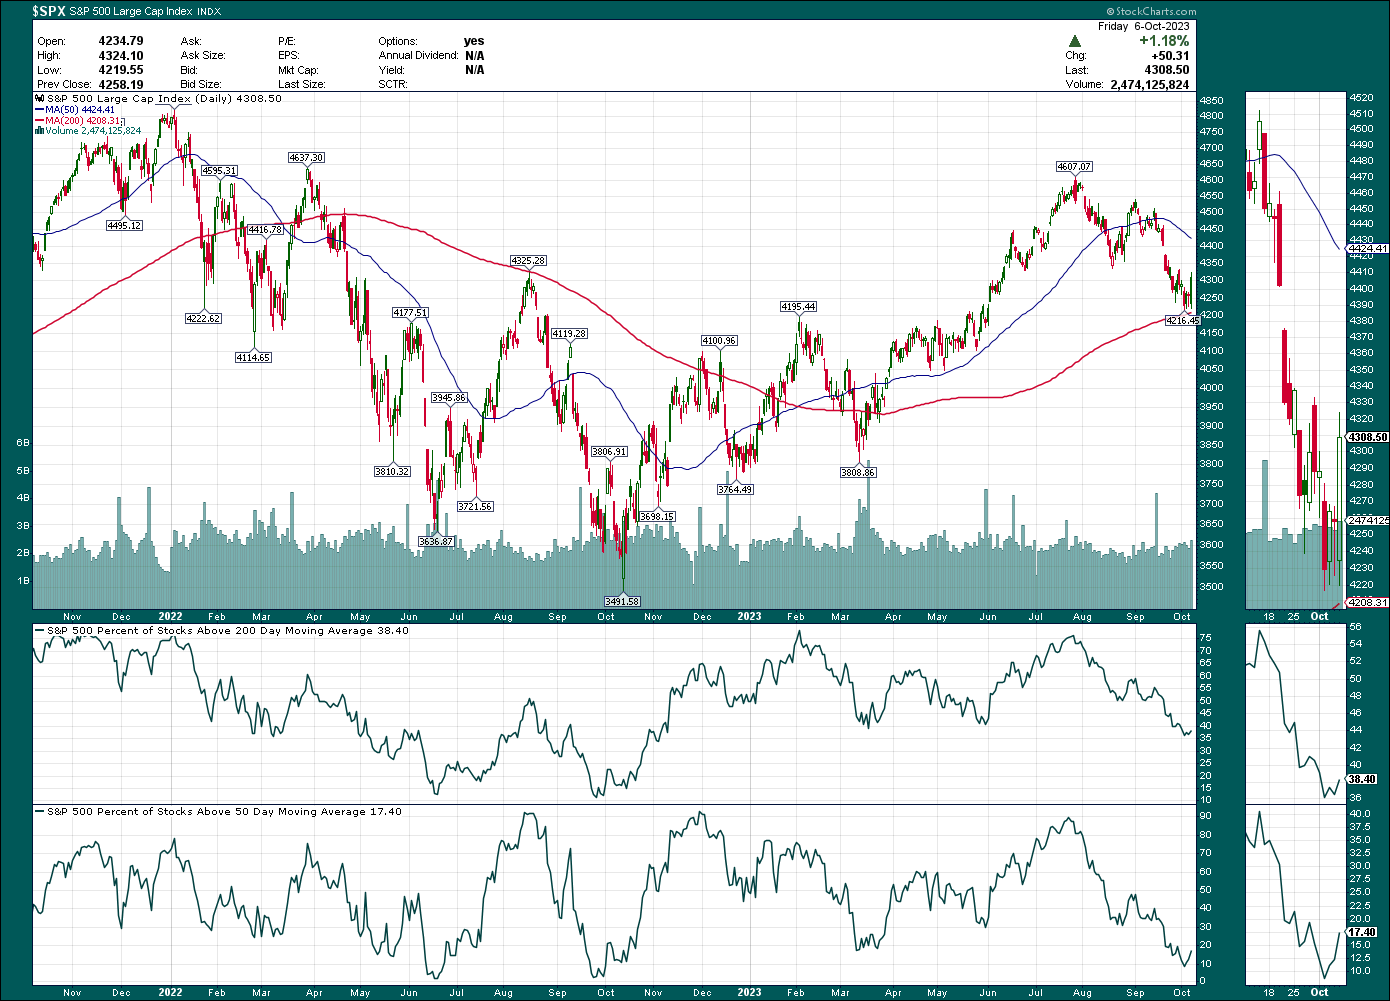
There’s a saying in the market, the market breadth is so bad that it’s good. While it’s not extremely bad yet, it’s bad enough for a bounce, SPX % of stock above 50D MA almost drop to single digit (less than 10%) last week, suggesting an oversold condition.
in the next articles, I will do a deeper dive into bond market.
Disclaimer : The information presented here are for research and education purpose only, and does not constitute investment advice, trading recommendation, author shall not liable for any action taken by any individual/company with regards to the information presented here or any part of the website - https://marketcycleedge.substack.com/