Daily market review Nov 6, 2024 ( Giant Melt up rally as Trump return to White House)
Hello Fellow readers and subscribers. Apologies for my long absence since my last post in September, as I was tied down with tons of Family commitment, from
1) changing my son preschool location, helping him to adjust to new school, the staying home in between switching school;
2) to accompanying my son for his multiple appointment ( pre and post admission ) to hospital, 2 admission and 1 surgery, not a major surgery but a necessary surgery to prevent future complications from Respiratory disease.
Therefore, I need to ease myself back into the market review routine and the incorporation of new data/routine into my market review routine.
Anyhow Market melt up and rally as a result of …….. Donald Trump emerging as Winner of US presidential election and market instinctively took a page from 2016 Trump trade
Conclusion of US election
As predicted by Polymarket, Donald J trump is the winner of US Presidential Election, it’s one hell of a comeback and will at least inject some common sense into Fiscal spending side of things, Border security.
Election watchers had an inkling that Trump would win by around 10 – 11 pm US eastern time, when Trump reverse Harris initial lead in Pennsylvania during the vote counting process.
In terms of market movement, at November 5th, 9am US eastern time, most major financial participant ( or Trading Algo ) were probably so relieve that the Election uncertain ties will soon be over, it started rallying from local bottom of around 5720. By 9pm US eastern time, market rally further for the next few hours once Trump Road to white house become clearer as he started commanding marginal lead in several swing state , most notably the all important Pennsylvania.
Major thanks to Unsung Scott Pressler for delivering crucial swing state of Pennsylvania to DJT
Unsung hero, Scott Presler X was flooded with YOU DID IT as Trump vote count started commanding a sizeable lead against Harris in Pennsylvania.
Scott Pressler is a conservative political activist, who had been trying to reach out to Amish Voters during Trump election.
Final voting count in Pennsylvania, is Trump 3.468 Million vs Harris 3.338 million, without a shred of doubt, Pressler and Amish voters played a major part in winning it from Trump, as Amish community of 170,000 strong members contribute significantly to Trump vote count.
Interesting fact for all, Trump is the first ever Republican candidate to win the buck county.
And in Lancaster county ( major Amish settlement ), Trump had a commanding 47000 lead against Harris.
Broad market overview
Transportation, Small & Mid cap were the major spotlight of the day, outperforming all other indices significantly as part of the Trump trade redux, Spring into life due to Trump deregulation, Potential Tax cut. The animal spirit and de-regulation factor of Trump trade will materialize with 100% certainty in the next few months as Republican is set to be granted total control of both Executive and legislative branch.
As for the Tax Cut side of it, there’s some doubt on that, even with Republican winning Presidency, Senate and congress, Fiscal capacity is not as robust as 2016 when Republican constrain Obama administration to exercise prudence and left something in the fridge for Trump tax cut in 2016.
And if Tariff War happens, Small and mid cap are more insulated from it compared to Large cap counterpart with significant global revenue receipt ( which could suffer if Tariff retaliation happen )
Overall, Mid and small cap, outperform Large Cap-weighted & equal weighted indices .
S&P 500 11 sectors overview
Financials, Industrials and Energy are the best performing sectors. while Real estates, Staples and Utilities are the bottom ranking sectors.
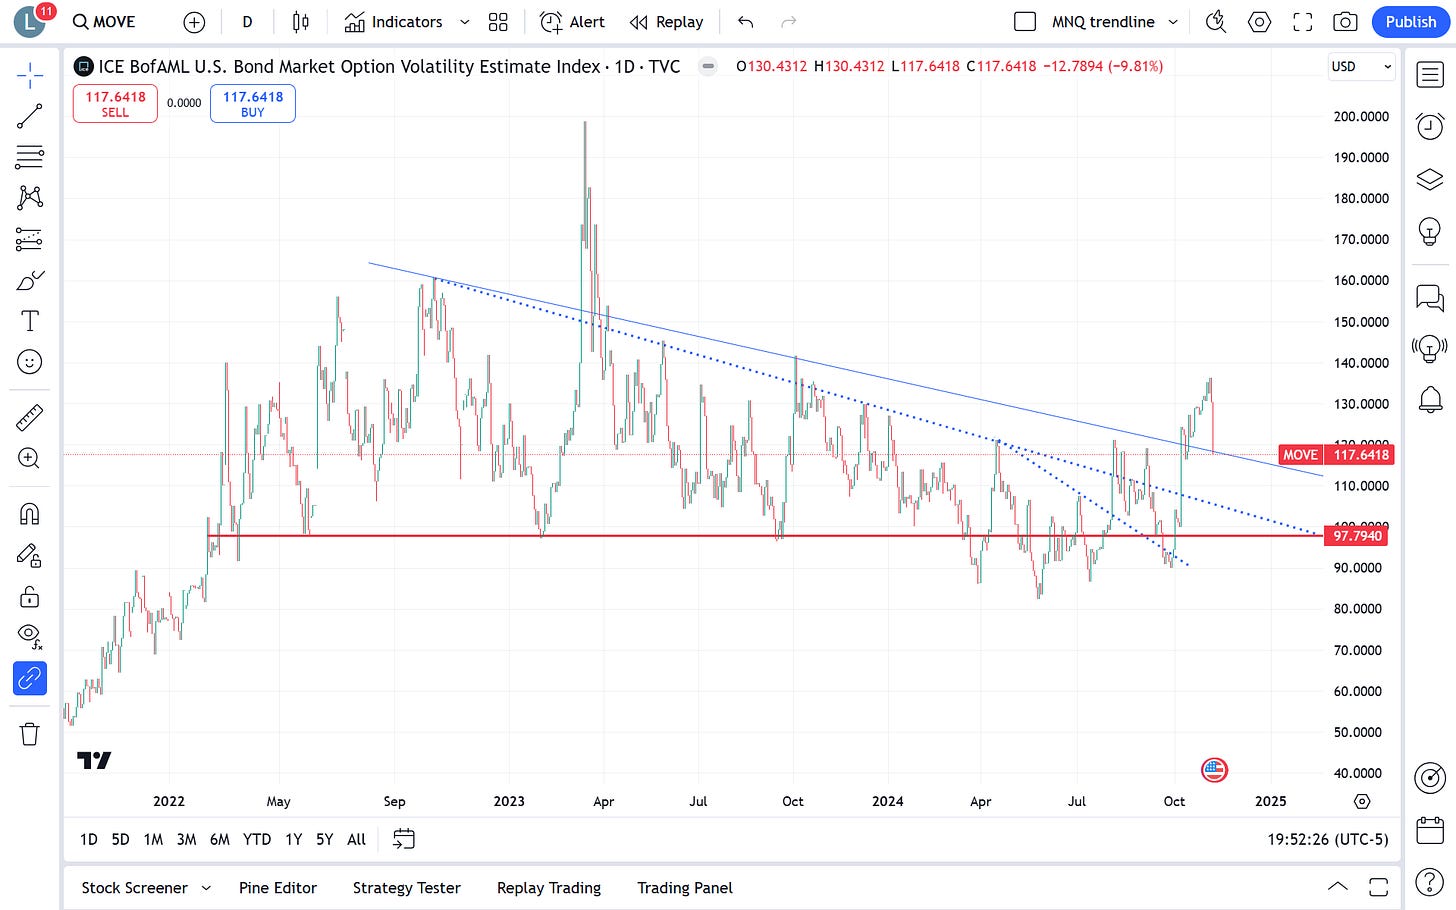
MOVE index
Move index is currently at 117.64, bond price implied volatility is expected to be around 11.76 per annum.
This is a major relief and 1 Day drop post election, as it was heading towards dangerous 140 level, as Market were grip by
1) the prospect of re-ignition of inflation
2) the prospect of higher yield ( bond sell off as market realize US Gov budget arithmetic will be negative with either candidate, budget deficit either from lower tax revenue or higher spending )
Not to mention the following factor that started it all
3) Bond yield rise as a market unwind the long bond trade (unwind recession insurance hedge as hard landing scenario of higher unemployment is avoided )
NYSE & Nasdaq market internals
There are more Advancers than Decliner. And it’s occurring at a Higher volume than previous week.
On Nov 6 2024,
1.6 to 1 NYSE Advancers to Decliner ratio (1732/1083 )
1.18 to 1 Nasdaq Advancers to Decliner ratio (2789/1516 )
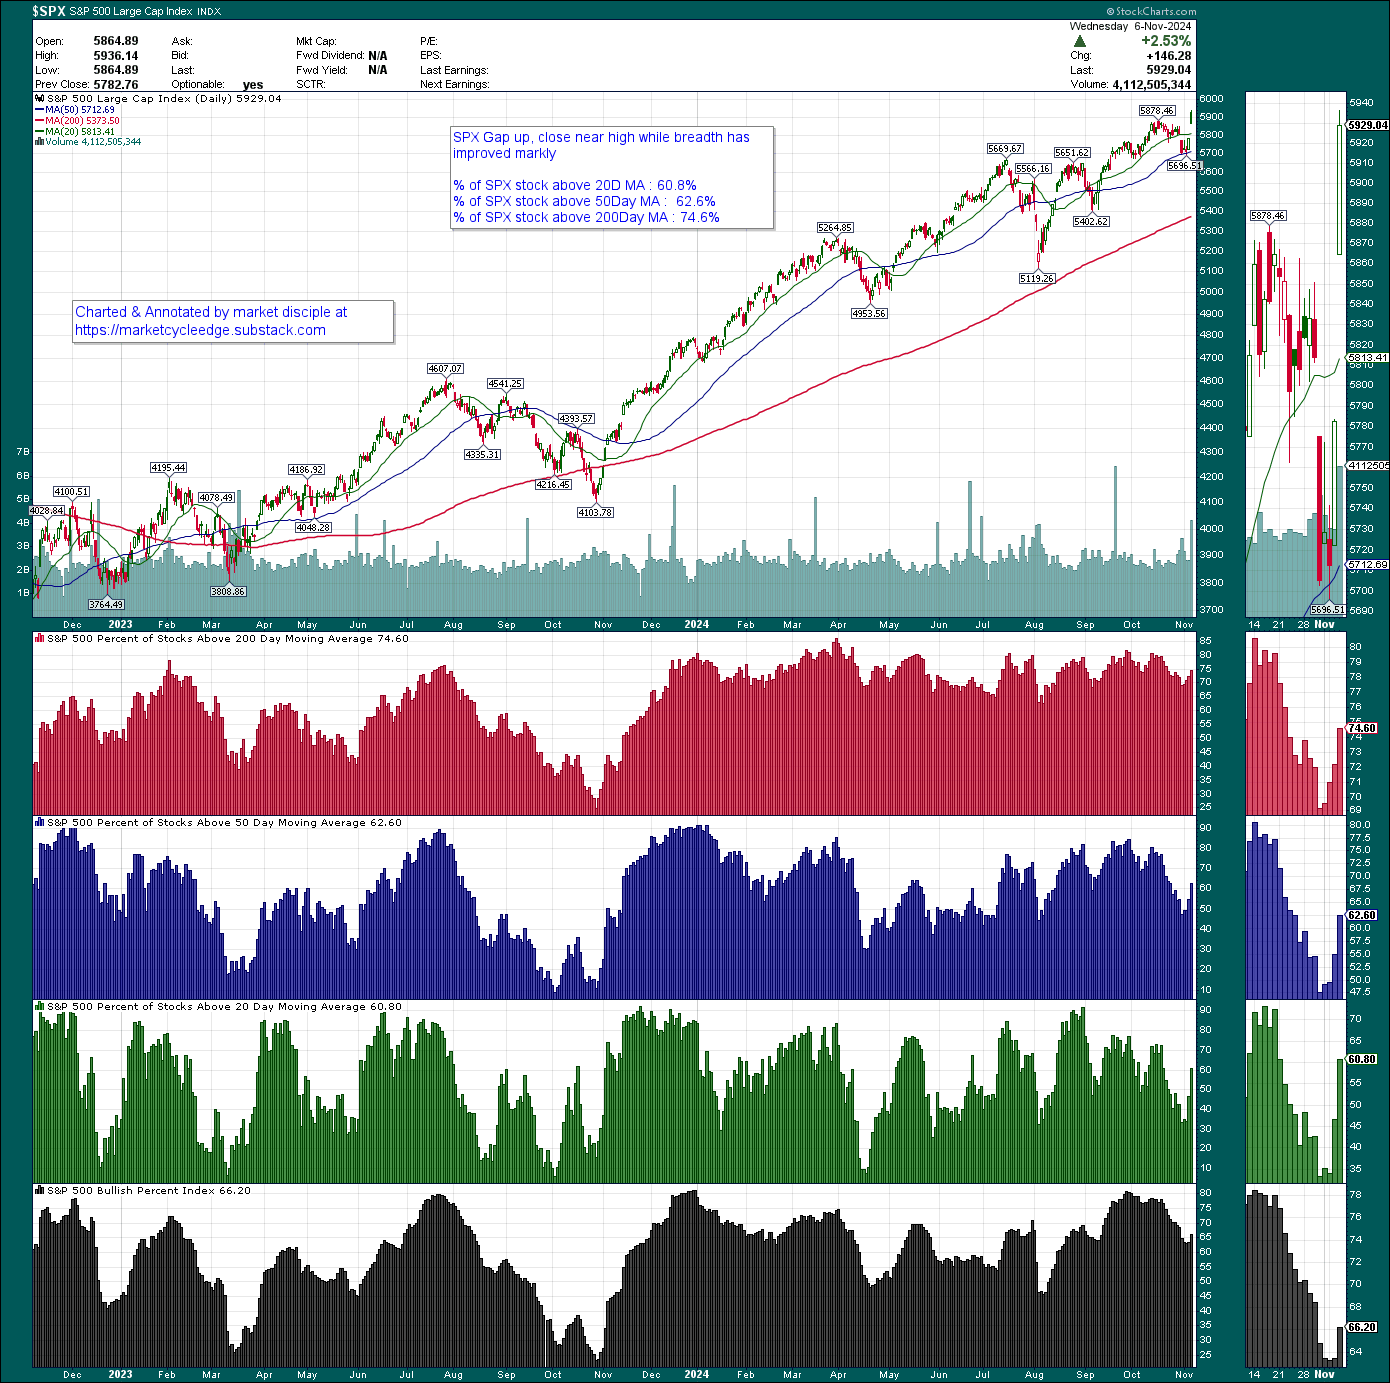
% of SPX stocks above 20D 50D 200D moving average
SPX gap and close higher while breadth improve markedly
% of SPX stock above 20D MA : 60.8%
% of SPX stock above 50Day MA : 62.6%
% of SPX stock above 200Day MA : 74.6%
Bitcoin
According to the foremost Global Liquidity Expert, Bitcoin track the Global Liquidity relatively closely, lagging only by about 6 weeks, it display the quickest responsiveness to changes in liquidity conditions.
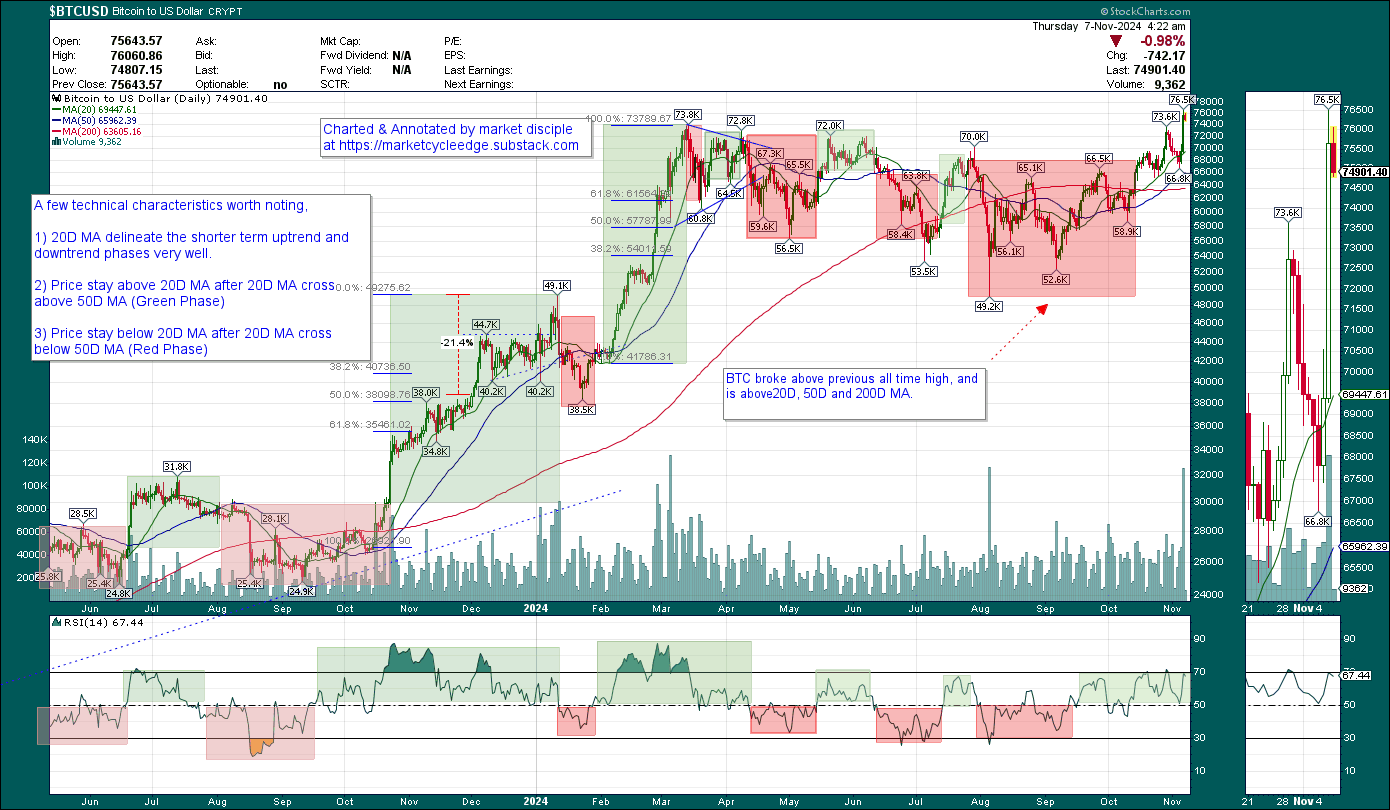
Bitcoin daily chart
BTC broke above previous all time high, and is above20D, 50D and 200D MA.
By the Way, the Trade That I have initiated in August are still active and is paying BIGly… I will post an update for my subscribers sometime by today or tomorrow.
If you would like to know more about
1) the upcoming opportunity vs risk , and actions to take for your portfolio
2) my thoughts on latest market development
then join my Paid subscription
Cost vs Benefit of joining paid subscription
For a price of USD 15 per month ( USD 0.50 per day ) or USD 149 per year (less than USD 0.42 per day ) I will give multiple big ideas per year to capitalize on biggest trends and shift in financial market to accelerate the growth of your savings / investment accounts.
That’s right, for the price USD 0.50 or less than USD 0.42 per day, you could gain 4 digit or 5 digit in USD annually with a small account if you catch any 1 of the biggest trends from my ideas & suggestions. I deliberately keep it low to make it extremely affordable and accessible for those with small savings to access high quality research, market leading indicators/charts.
As always, we will continue to monitor the charts, assess the bullish/bearish evidence day-by-day to make appropriate capital allocation and investment decisions on all time frame ( short, mid & long term )
Disclaimer : The information presented here are for research and education purpose only, and does not constitute investment advice, trading recommendation, author shall not liable for any action taken by any individual/company with regards to the information presented here or any part of the website - https://marketcycleedge.substack.com/
The views expressed on this website represent the current, good faith views of the authors at the time of publication. Please be aware that these views are subject to change at any time and without notice of any kind. Marketcycleedge.substack.com and its author assumes no duty and does not undertake to update these views or any forward-looking statements, which are subject to numerous assumptions, risks, and uncertainties, which change over time. All material presented herein is believed to be reliable, but we cannot attest to its accuracy. The information contained herein (including historical prices or values) has been obtained from sources that marketcycleedge.substack.com and its author considers to be reliable; however, marketcycleedge.substack.com and its author makes no representation as to, or accepts any responsibility or liability for, the accuracy or completeness of the information contained herein, or any decision or action taken by you or any third party in reliance upon the data. All traders and investors are urged to check with Financial advisors before making any trading /investment decision.


