
Daily Market Review Nov 2 2023 ( Broad based Market rally, HUGE buying volume,10Y yield drop to 4.67% )
Daily Market Review Nov 2 2023 ( Broad based Market rally, HUGE buying volume,10Y yield drop to 4.67% )


10year-yield fell to 4.67% ( drop to a session-low of 4.60% on intraday basis). As a result, Broad Market had a rip-your-face-off rally on Nov 2. S&P500 close above 4300.
Probability of Oct 27 being the S&P500 bottom is CONFIRMED because there is huge buying strength ( high A/D breadth + 89% UP volume day ).
Looking back, S&P 500 reversed at confluence of following technical levels. ( & fall of 10Y-yield )
1) Fibonacci retracement 61.8% of March low to July High ( 4110 )
2) Anchored VWAP of Oct 2022 low and Dec 2021 high ( 4140-4150 )
3) Liquidity base of 4050–4200
4) 40Month-MA of 4090 ( litmus test of Secular bull market )
5) NYMO&NAMO divergence
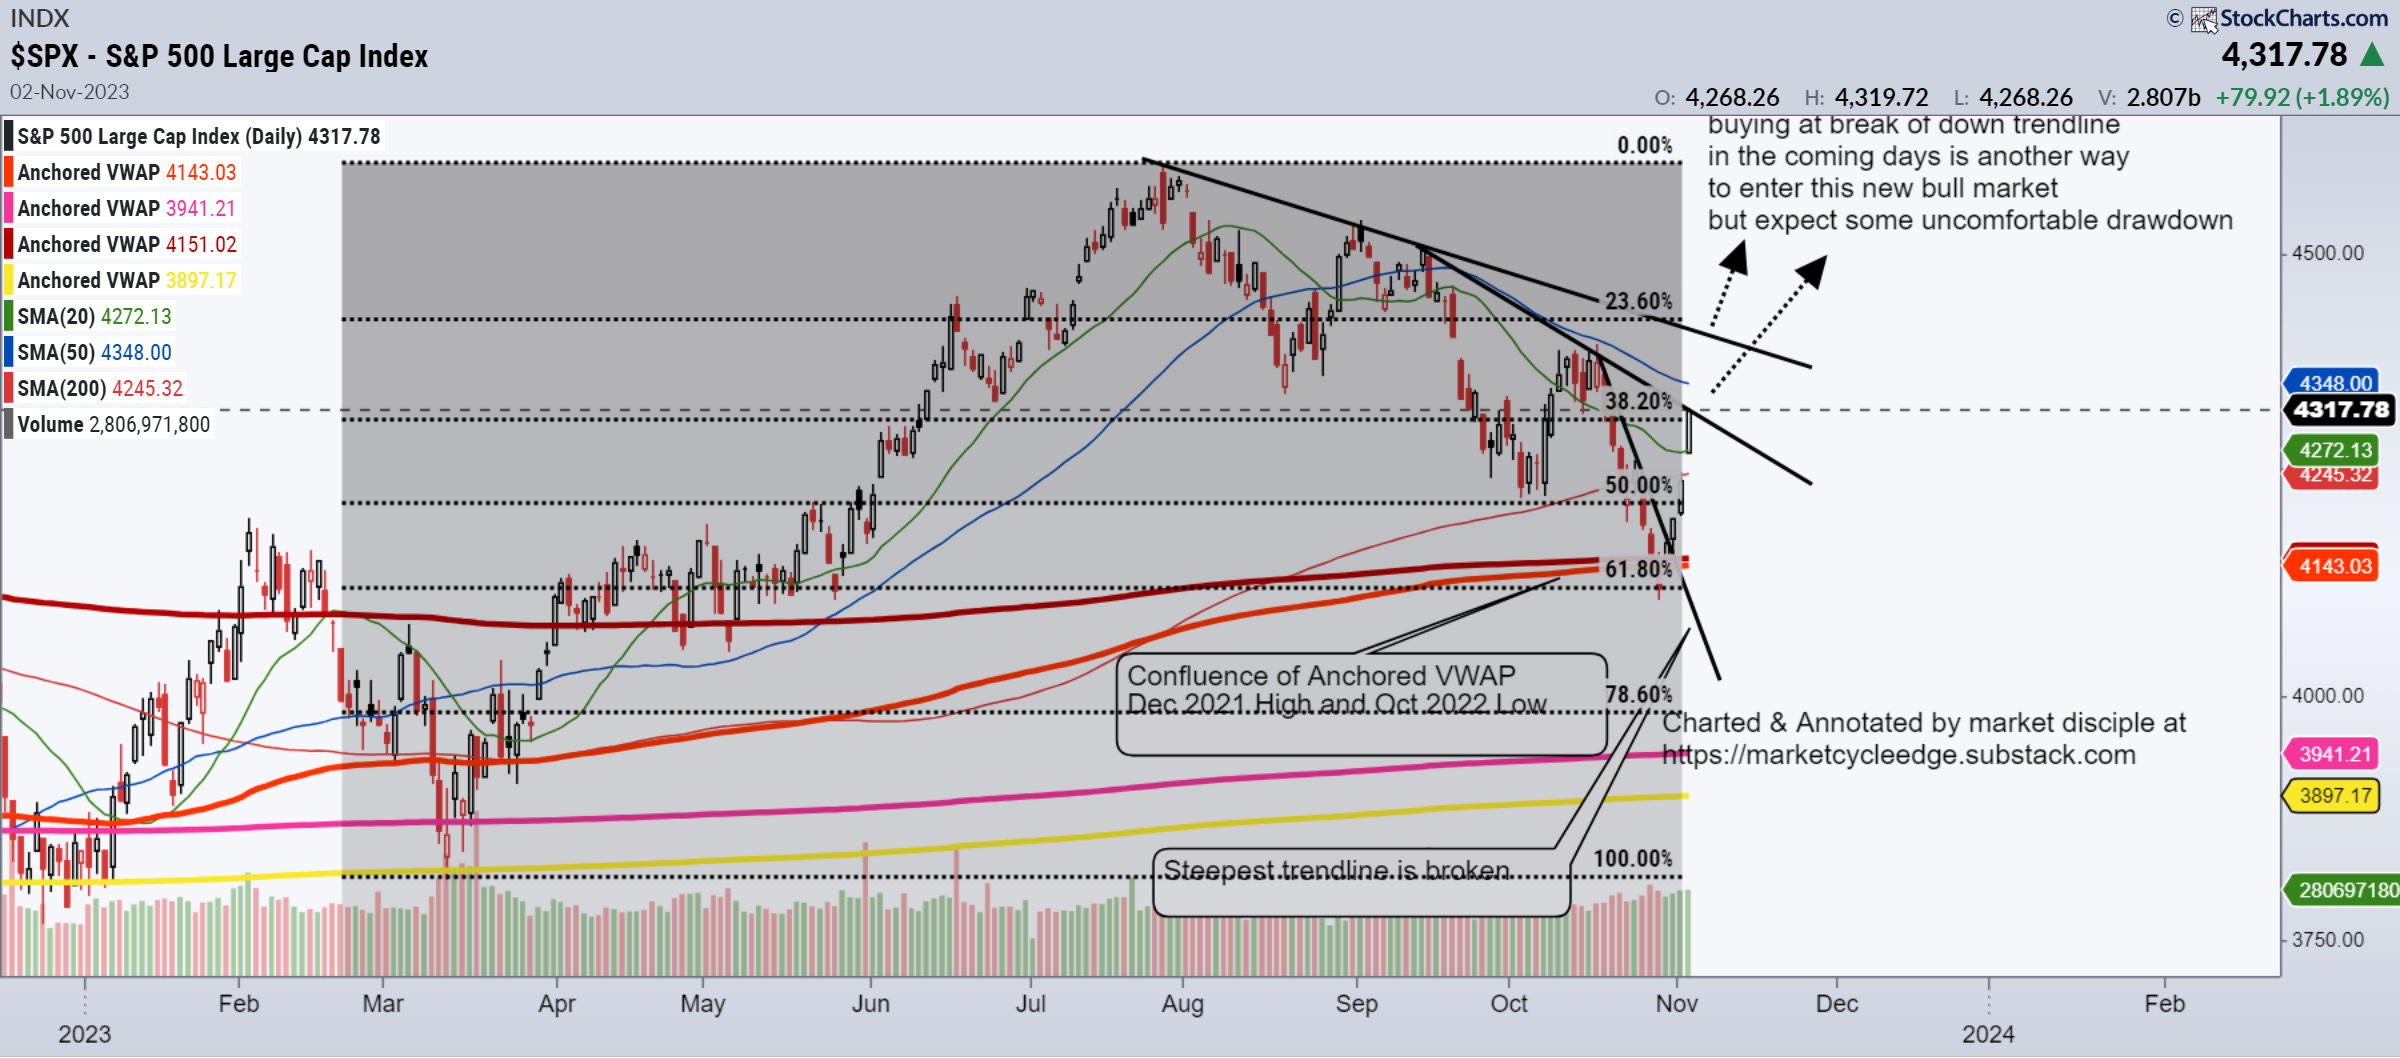
If you miss the reversal&is still in cash, is there another way for you to participate in this new bull market? You could try to enter at the break of down trendline, but one should expect some drawdown because market could retest previous gaps/support along the way. ( backing&filling )
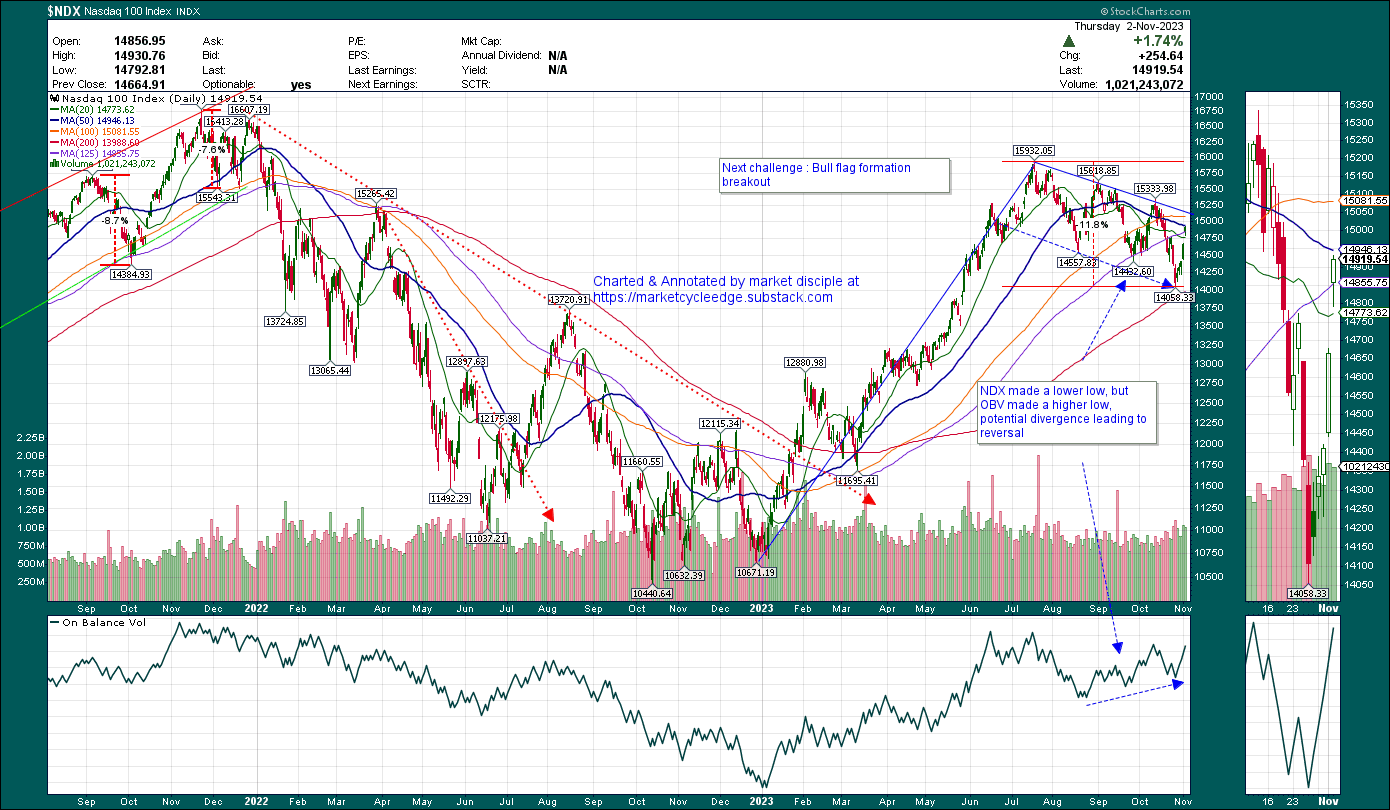
While NDX bottomed with the presence of following technical signals. ( & fall of 10Y yield )
1) Close to 200day MA @ around13940 by end October
2) NYMO&NAMO divergence
Reversal scenario should be considered seriously because Market has satisfied more of the following conditions

Interestingly, another offensive sectors Consumers discretionary-XLY had just recaptured 200Day-MA. And Nasdaq is outperforming SPX as per charts above ( Nasdaq 100 is leading broad market rally )

Things that I like ( charts hinting at bullish odds )
High A/D breadth thrust & 89% UP volume day (with heavier NYSE volume)
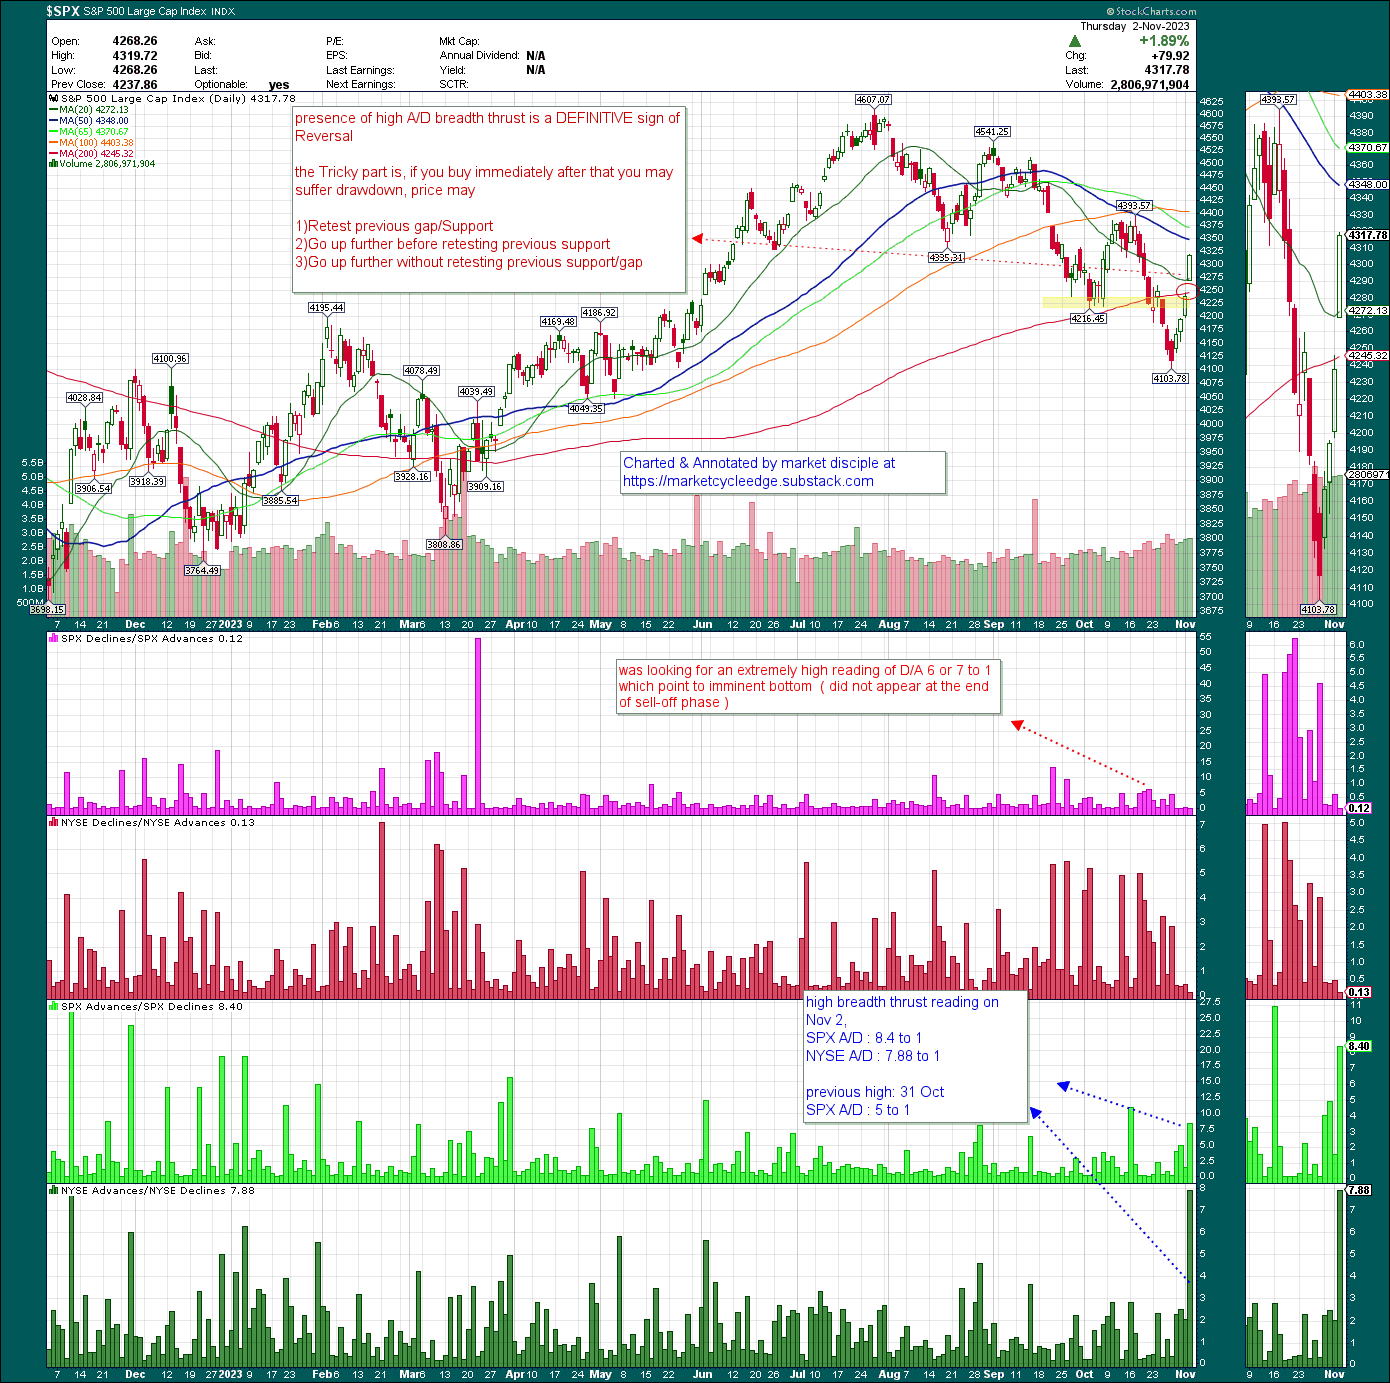
For the first time in many months, we have a combination of high A/D breadth thrust and 89% UP Volume day, this combination is a DECISIVE reversal sign.
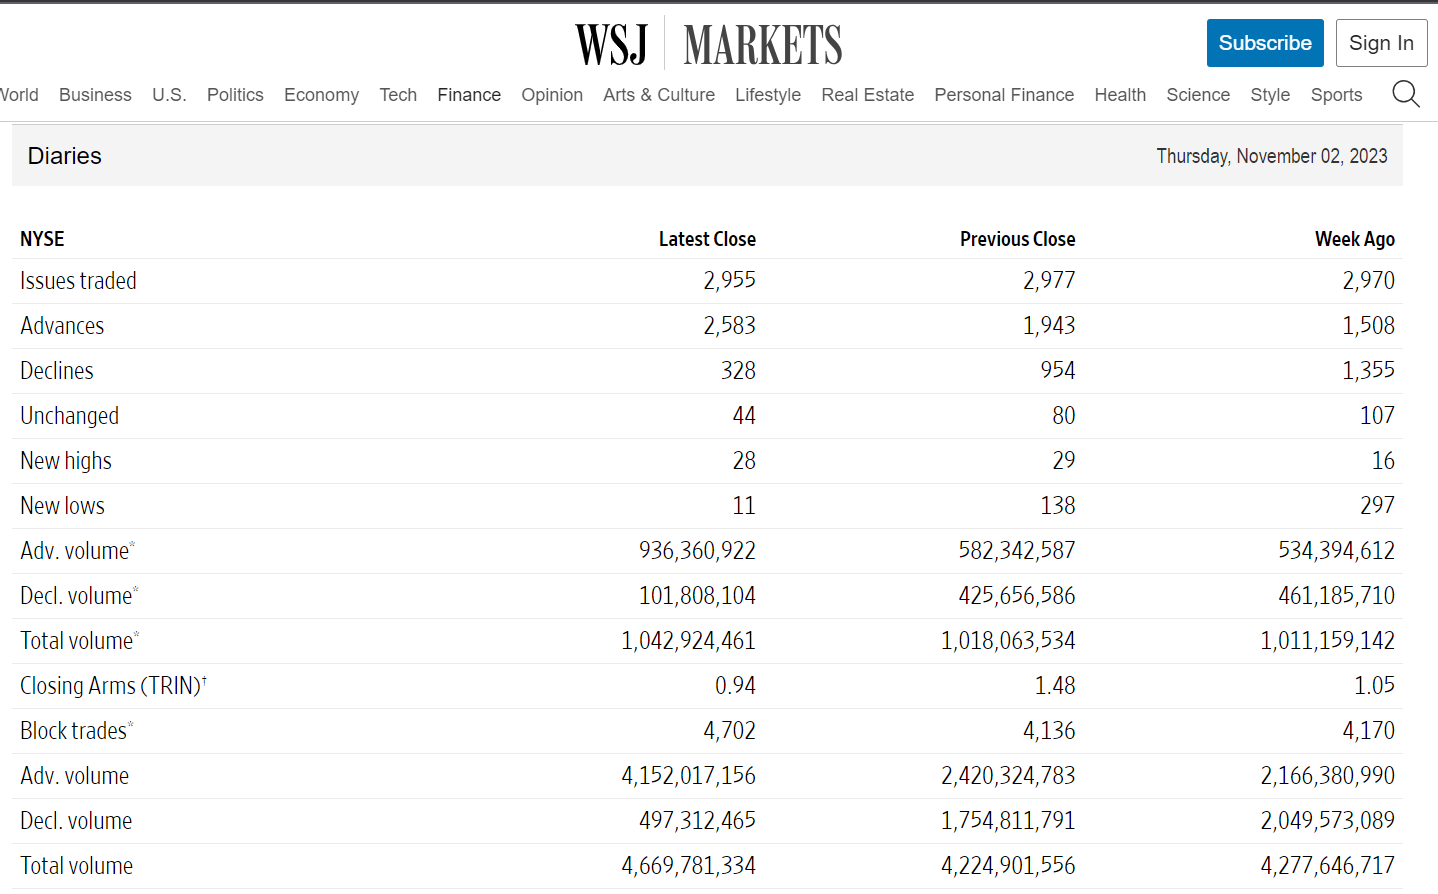
Wednesday Nov 1, 2.03 to 1 NYSE Advancer vs Decliner ratio
Thursday Nov 2, 7.87 to 1 NYSE Advancer vs Decliner ratio (2583/328)
89% UP volume day (936,360,922/1,042,924,461)
Oct-31 to Nov-2 NYSE volume are higher than previous week, a positive development
Caution is warranted here because there could be temporary pause/backing &filling in the market after the appearance of huge UP volume day + A/D breadth thrust, buying here immediately may cause drawdown, but Dip in the coming days are buyable.
Junk bond and 10Year-yield
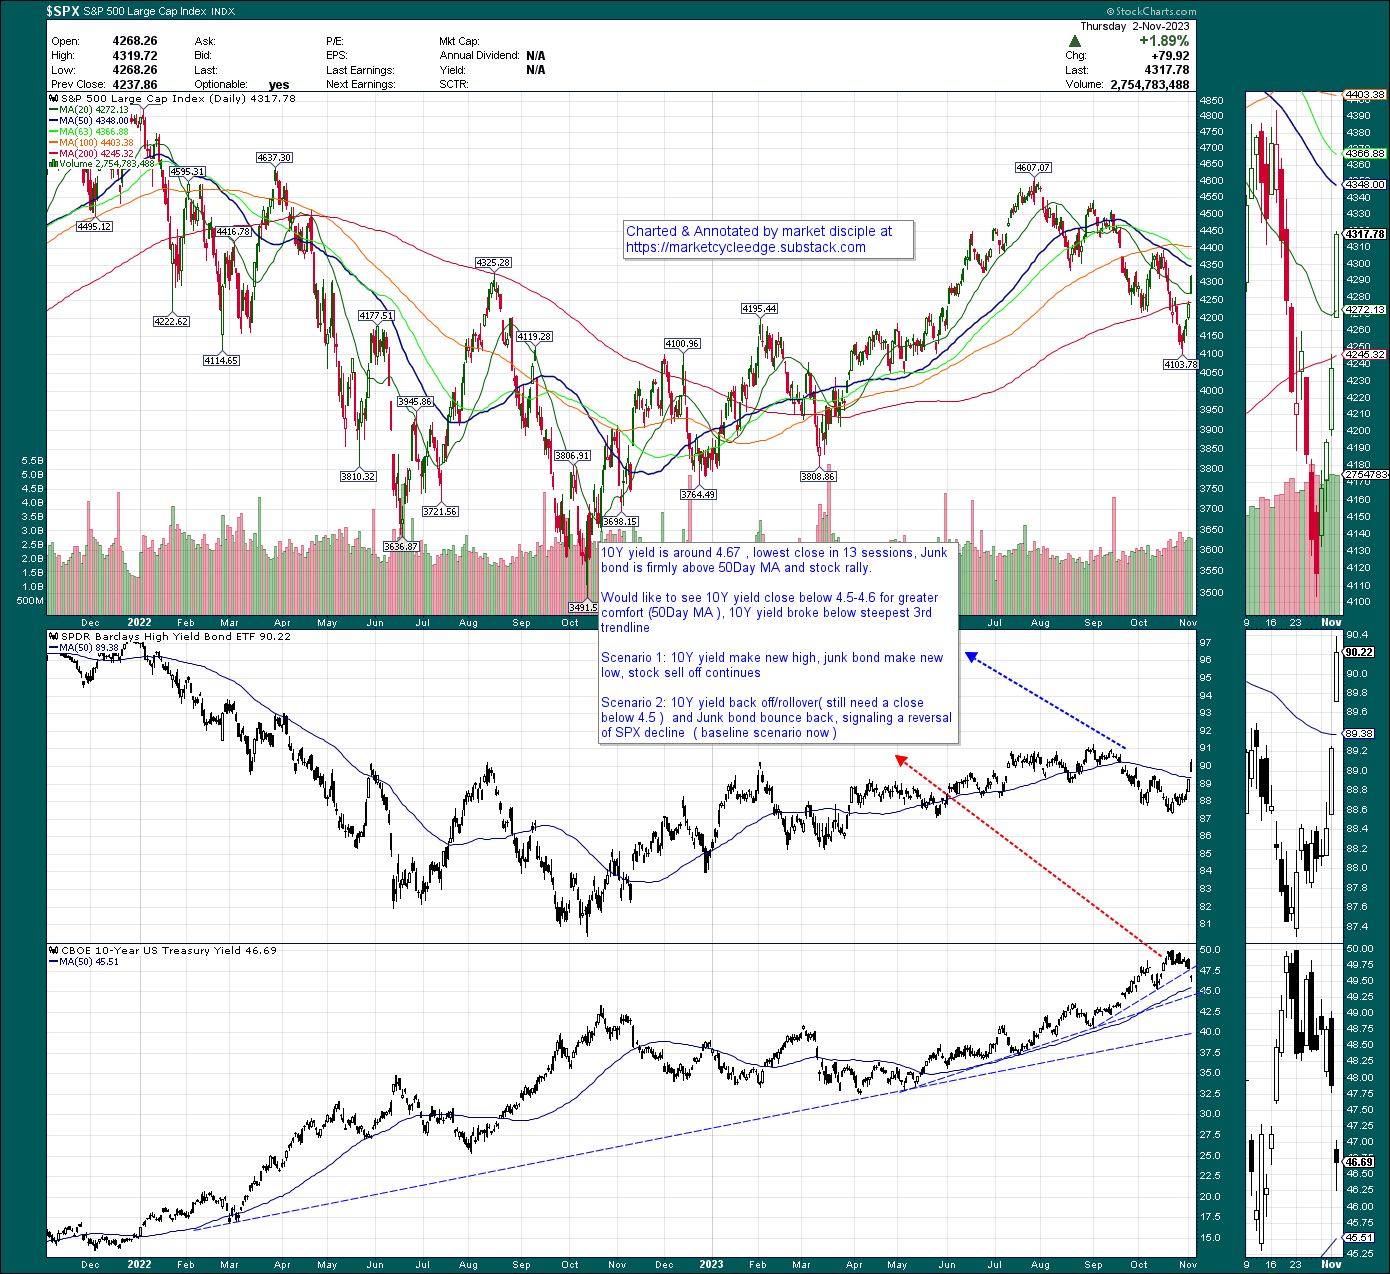
10Year-yield closed at 4.67, broke below 3rd steepest trend line, lowest close in past 13 sessions. Junk bond rally higher and recapture 50Day-MA. Still would like 10Y-yield to break lower for further progress of market rally.
Offensive sector outperformance on 1week basis ( Oct 27 – Nov 2)

Offensive sector ( Technologies, Communications , Consumer discretionary) outperform Defensive sector (Utilities, consumer staples).
MOVE index
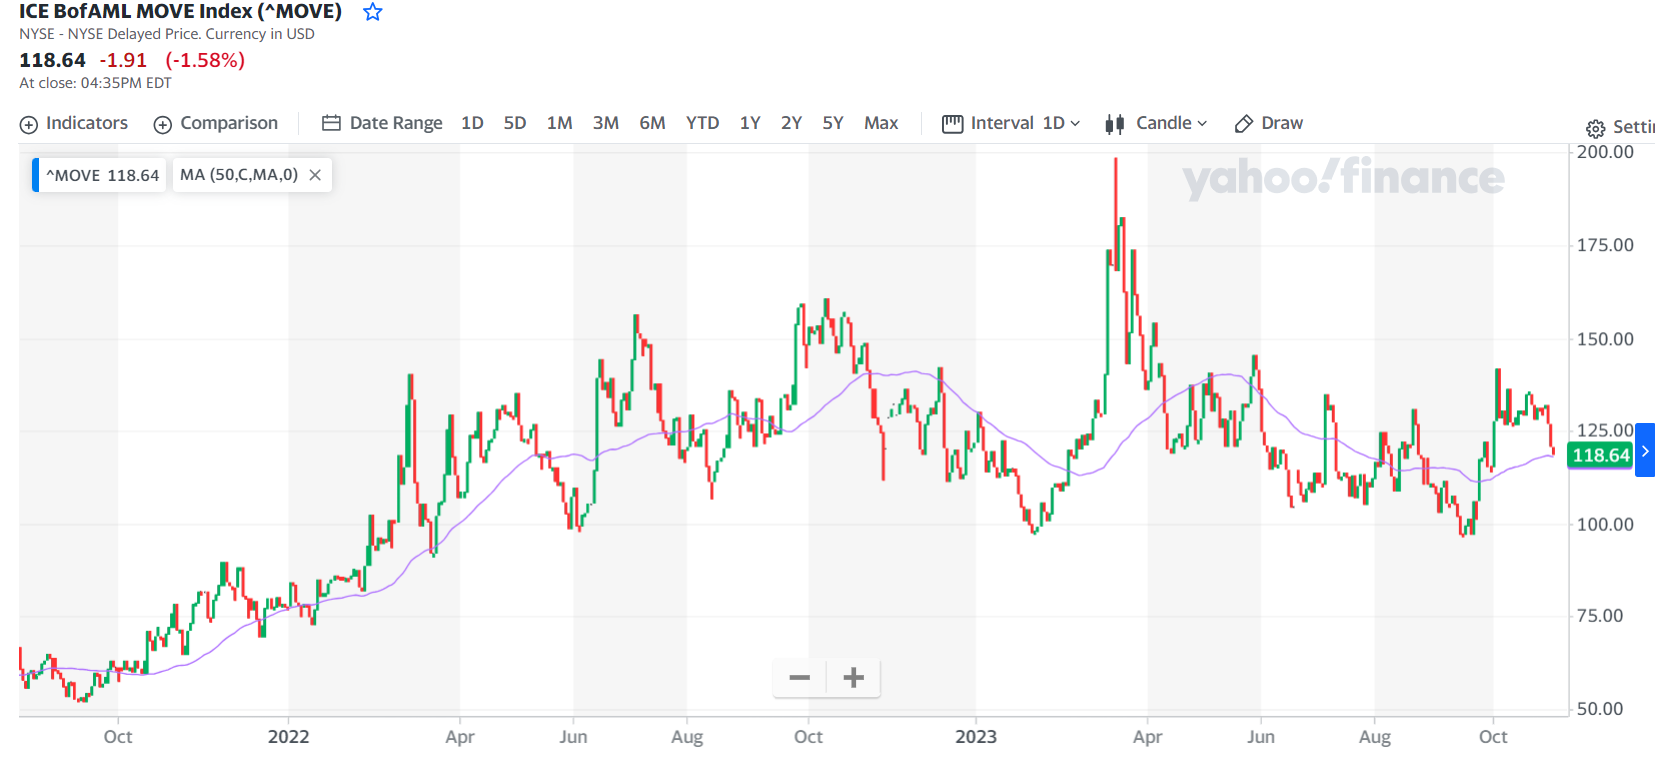
MOVE index closed lower at 118.64, next challenge=crossing below50Day-MA ( Lower MOVE index decrease bond haircut, causing an increase in collateral value of bond, leading to more fund available for big institutions, thereby increasing market liquidity. )
Things which has improved ( but pending further progress)
% of SPX stock above 50Days&200Days-MA
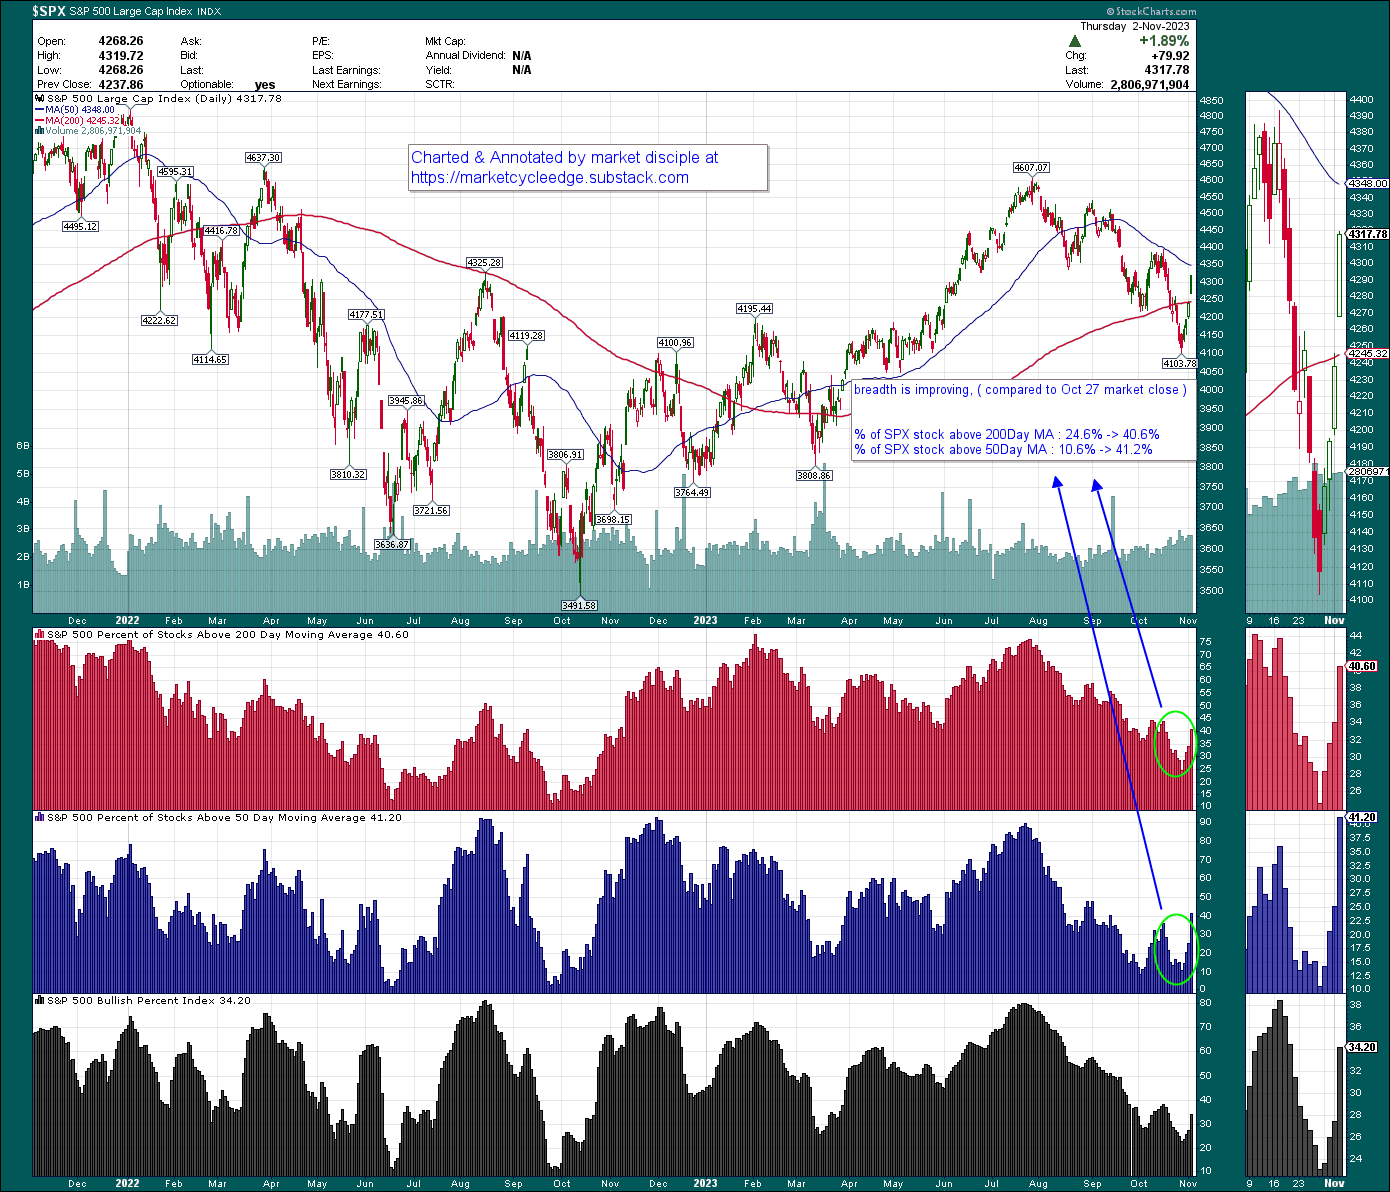
breadth is improving,
percentage-of-SPX-Stock above 50Days-MA, recover from Oct-27 low of 10.6 to 41.2% .
percentage-of-SPX-Stock above 200Days-MA, recover from Oct-27 low of 24.6 to 40.6% .
Homebuilder ETF (XHB)

Housing sector is 12% of US economy. XHB recaptured 200Day-MA, now we need it to stay above 200Day-MA consistently, and take out previous swing high at 77-78 level.
this section is worth repeating, Some readers have reached out to me privately and ask how do I monitor the charts, assess the bullish/bearish evidence day-by-day to make appropriate capital allocation&investment decisions.
Essentially, Capital allocation decision can be divided into Short-mid term tactical trading & Long-term capital allocation.
The following sections are illustrated as a educational/informational guidance, ( disclaimer apply, use at your own risk )
Short-mid term tactical trading. (real life example)
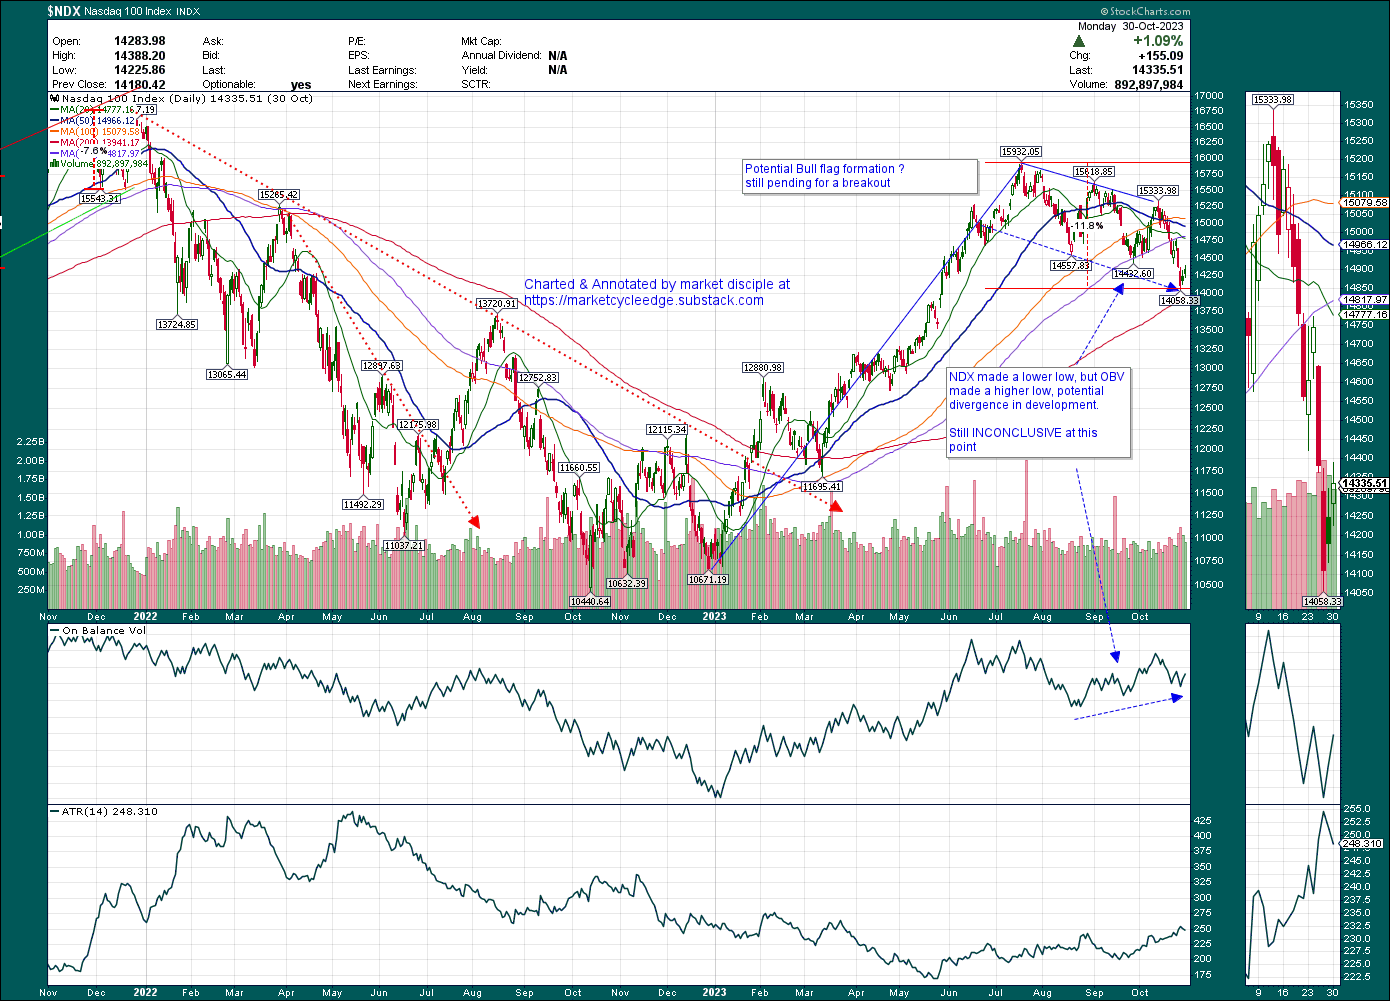
I have taken an NDX trade @Oct-31 for the following reasons
1) Near 200day-MA ( around 13940 )
2) OBV divergence, NYSE&Nasdaq McClellan Oscillator divergence
3) %-of-SPX-stock above 50Day-MA is near extreme level 10.6% (would prefer it to go down to single-digit-% , but real life situation hardly lines-up perfectly)
Close enough to 200Day-MA that I can set stop loss of 1%/1-ATR below it to MINIMIZE RISK
Another consideration point, XLK, SMH, XLC are the only sectors propping up the entire market, and if they are gone, the entire market would have been in the bloodbath, so make-or-break distinction is using NDX-200Day-MA - 1% (based on previous 14 days session ), acting as a stop loss target.
Assuming a starting capital of USD25,000, Risk = 5.5% of the capital*^ = USD1,375
Entry : 14450
Stop loss target: 13800 (200DMA = 13940 – 1%)
TP : close 50% of position 15600, and leave remaining 50% open.
Position sizing : 2.1 contract
Candidate : 1xMICRO E-mini NQ, 2xNDX CFD (USD 1) or ETF such as 200xQQQM or 31xQQQ
Long-term capital allocation ( ETF-SPY )
For long term holding, aim is similar, allocating capital by adhering to principal of minimum risk and good risk-reward ratio. As mentioned in previous entry, A good distinction of Secular bull-bear market for S&P 500 is 40months-MA 4100 - 200week-MA 3940.
Reasons for entering this long-term trade,
1) NYSE-McClellan Oscillator divergence
2) %-of-SPX-stock above 50Day-MA is near extreme level-10.6%
Assuming a starting capital of USD25,000, Risk = 20% of the capital = USD5,000
Candidate : SPY ( long-term holding, with dividend given)
Entry : 421
Stop loss target: 390 (200week-MA - 1%)**
Take Profit : TBD***
Position sizing : 160 x SPY
*^in future, I will write on risk management methods&comparisons for small-account size ( below USD99,000, slightly bigger risk capital % are allowed ), big-account size ( above USD100,000, stick to small risk capital of 1% to 2.5 % at all times)
**As this is a long-term Investment, drawdown is bigger and 200week-MA=390 was chosen stop-loss target currently, in future stop-loss will be updated according to 200week MA level.
***Holding duration is aimed at capturing the maximum upside potential of secular bull market. Therefore, TP target will be assessed by monitoring a different set of technical indicator input, to be reveal further in future entry.
Disclaimer : The information presented here are for research and education purpose only, and does not constitute investment advice, trading recommendation, author shall not liable for any action taken by any individual/company with regards to the information presented here or any part of the website - https://marketcycleedge.substack.com/