

Daily market review July 31st 2024 (Market rebound post BoJ and FOMC meeting)

Broad market overview

Cap weighted indices rebound convincingly off the swing low from previous day July 30th market session.
Why did the market fall on July 30th ? Likely a leak from Bank of Japan about the rate hike, which wrong footed the market as consensus only expected Quantitative tightening but not Rate hike. Yikes, The leaks from BoJ is getting too regular. So if USD JPY / Nikkei move before the meeting date, you could take an intelligent guess at the implications of leak content to the market )
Why did the market rebound post US market close, July 30th ? Could be a function of both anticipated dovishness from Fed and AMD earnings. So Lisa Su and Jay Powell have saved the market. ( and market has moved on from Japanese yen short unwind jitter )
Anyhow, Semi gain more than 7%, and Nasdaq 100 gain 3%, while S&P 5000 gain around 1.5%.
Overall, Cap weighted indices outperform equal weighted counterpart, small and Mid cap indices.
S&P 500 11 sectors overview

Technology, Discretionary, and Utilities are the best performing sectors. While Healthcare , Real estate and Staples are the bottom ranking sectors.
MOVE index

Move index is currently at 99.40, bond price implied volatility is expected to be around 9.95% per annum. Lower MOVE points to (implied) lower bond market volatility going forward.
Bond volatility moving lower translates into less haircut to bond, in which more liquidity can be extracted from the collateral pool.
NYSE & Nasdaq market internals

There are more Advancer than Decliner.
On July 31 2024,
1.68 to 1 NYSE Advancer to Decliner ratio (1762/1049)
1.6 to 1 Nasdaq Advancer to Decliner ratio (2585/1620)
% of SPX stocks above 20D 50D 200D moving average

Breadth is improving as price bounce from 50D MA
% of SPX stock above 20D MA : 68.2%
% of SPX stock above 50Day MA : 73%
% of SPX stock above 200Day MA : 80%
Summary post BoJ and FOMC meeting
As I have highlighted to the paid subscribers, the market risk ( & the fall ) in the past 2 weeks was coming from highly anticipated Quantitative tightening plan from Bank of Japan, and the associated positioning unwind of Japanese yen short ( and the associated de-risk movement in liquidating the profitable position of tech sector bet )

I believe we have emerged from Yen short positioning unwind scare, as the co-movement between Nikkei 225 and USDJPY has just been broken. Nikkei 225 has stop making new low, which I believe is constructive. USDJPY continue fall is caused by Dollar weakness.
As for Federal reserve, there’s a mark shift in the statement, The Committee's assessments will take into account a wide range of information, including readings on labour market conditions, inflation pressures and inflation expectations, and financial and international developments. ( I believe the international is referring to BoJ rate hike and QT ) as opposed to solely inflation mandate in the past, while also teasing us about a September rate cut. All in all, telegraphing a decisive dovish shift in monetary policy stance
Market scary plunge on July 30th and NDX with 63D Bollinger band.

During July 30th US market session , market plunge was scary even for seasoned participants, watching the tick by tick fall is nerve wrecking to say the least. ( but essential to the development process as both an investor and a trader ) so what did I do to alleviate my scare ?
One of the thing that could alleviate the scare is watching the market response around 63D SMA Bollinger band, would it breakdown further and retest the lower band or would it rebound ? Currently, it has rebounded above 63D SMA after undercutting it ( AKA false breakdown, bullish sign )
Nasdaq 100 63D-SMA Bollinger band

Just a reminder to the newer subscribers, Large Institutions rebalance their portfolio every quarter, 3 month = 63 trading days, this is rationale behind the creation of this chart with this indicator setting.
NDX and SPX bounce from trendline
NDX
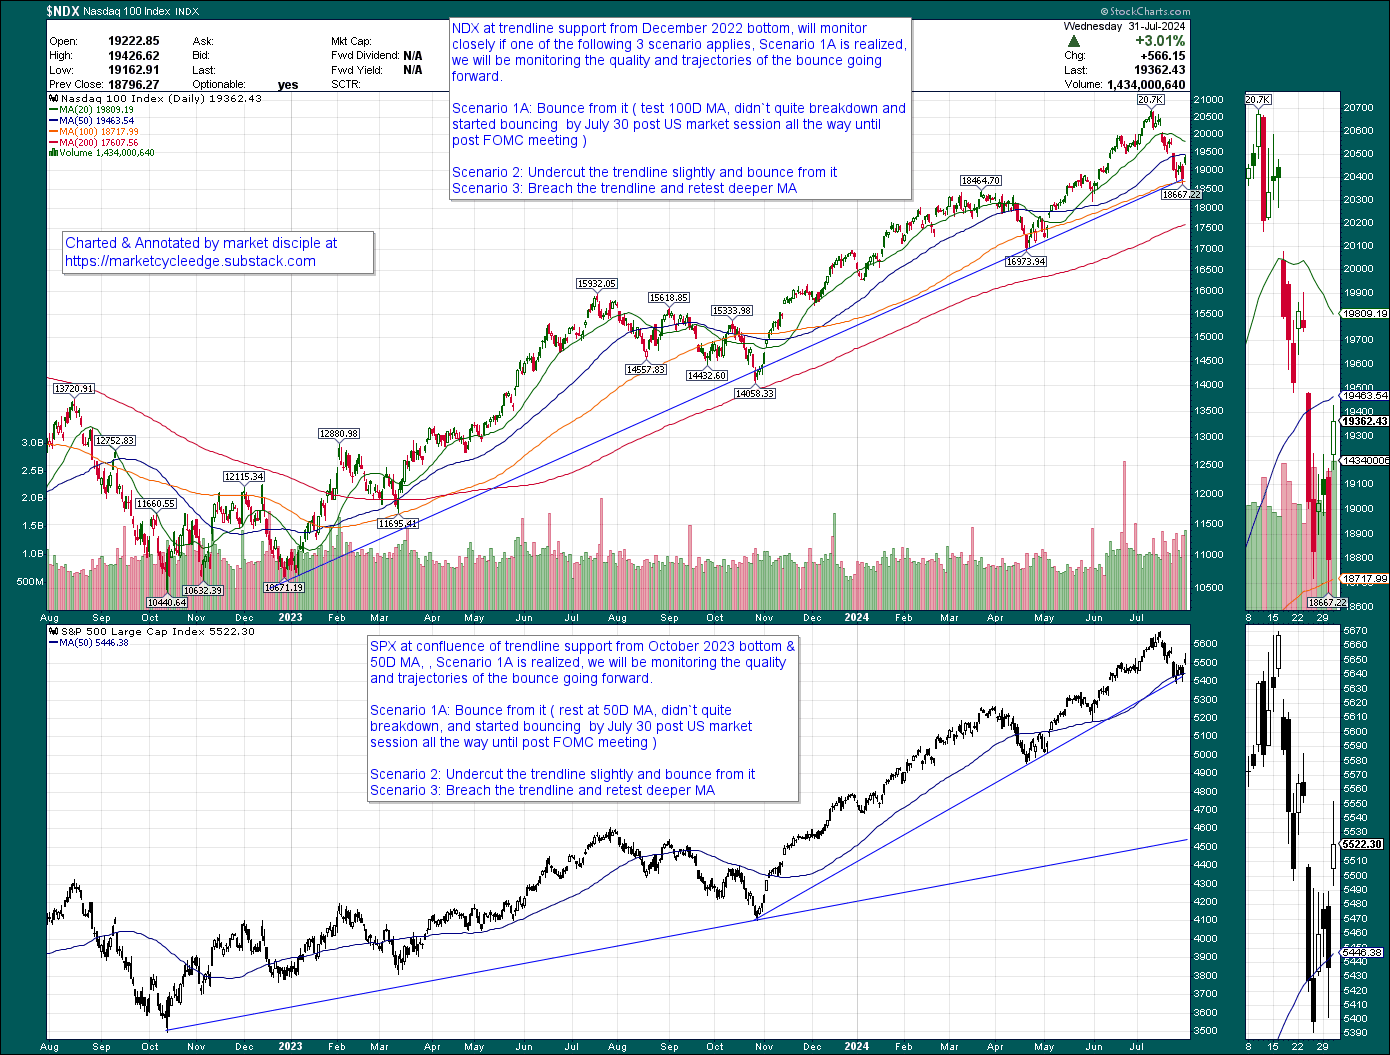
NDX at trendline support from December 2022 bottom, will monitor closely if one of the following 3 scenario applies, Scenario 1A is realized, we will be monitoring the quality and trajectories of the bounce going forward.
Scenario 1A: Bounce from it ( test 100D MA, didn't quite breakdown and started bouncing by July 30 post US market session all the way until post FOMC meeting )
Scenario 2: Undercut the trendline slightly and bounce from it
Scenario 3: Breach the trendline and retest deeper MA
SPX
SPX at confluence of trendline support from October 2023 bottom & 50D MA, , Scenario 1A is realized, we will be monitoring the quality and trajectories of the bounce going forward.
Scenario 1A: Bounce from it ( rest at 50D MA, didn't quite breakdown, and started bouncing by July 30 post US market session all the way until post FOMC meeting )
Scenario 2: Undercut the trendline slightly and bounce from it
Scenario 3: Breach the trendline and retest deeper MA
Bitcoin
According to the foremost Global Liquidity Expert, Bitcoin track the Global Liquidity relatively closely, lagging only by about 6 weeks, it display the quickest responsiveness to changes in liquidity conditions. ( In my next market entry I will add Ethereum )
Bitcoin daily chart

Currently it is retesting 50D MA, and RSI is at momentum inflection point , 50 , it need to reassert itself and bounce soon to keep the BTC rally hypothesis alive.
the following happened as it emerge from bottom
1) Price rose above 20D, 50D, and 200D MA in quick succession
2) making a higher high
Were you overcome with deep seated anxiety or suffer insomnia over the latest episode of market swoon ? Would you like to have additional charts and tool set to calm those nerve ? If your answer is yes, then you should join my paid subscription.
If you would like to know more about
1) Current/upcoming market risk factors + additional charts/indicators to see market reaction to those risk factors
2) what is the most compelling opportunity in the current environment
3) my thoughts on latest market development
then join my Paid subscription
Cost vs Benefit of joining paid subscription
For a price of USD 15 per month ( USD 0.50 per day ) or USD 149 per year (less than USD 0.42 per day ) I will give multiple big ideas per year to capitalize on biggest trends and shift in financial market to accelerate the growth of your savings / investment accounts.
That’s right, for the price USD 0.50 or less than USD 0.42 per day, you could gain 4 digit in USD annually with a small account ( 4 digit - low 5 digit account ) if you catch any 1 of the biggest trends from my ideas & suggestions. I deliberately keep it low to make it extremely affordable and accessible for those with small savings to access high quality research, market leading indicators/charts.
The following sections are for paid subscribers
Paid subscribers will get my thoughts on the latest update in the market as the situation/development unfolds. You will also get access to higher quality indicator to get a better handle on the market, and triangulate your entry point at Buying/accumulating your 401K ETF product. Conversely, I will also share strategies and timing ideas to avoid upcoming risk and protect your portfolio should there be incoming market risk in the near term horizon.