

Daily market review Jan 31st, 2024 (broad based market decline post QRA, post FED meeting)


Broad market overview
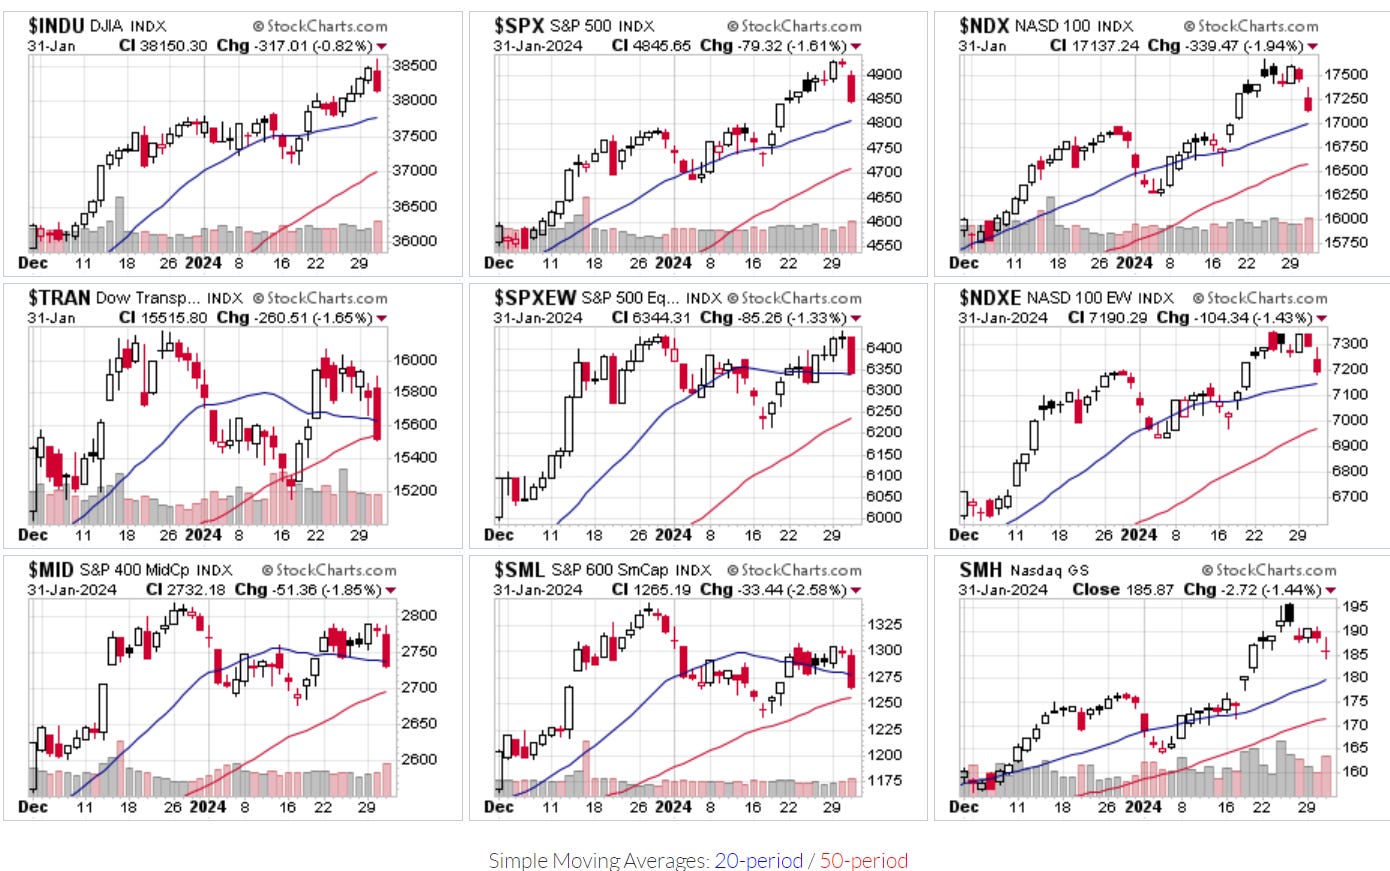
On Jan 31st 2024 Session, every US major indices fall after QRA and fed meeting, between 0.8% to 2.6%. As pointed out yesterday, new high in DJIA was not confirmed by Transportation for several sessions, This divergence is resolved currently by DJIA falling down, we will see in the next few session how much further both will fall.
It seems that market have an initial verdict, the recent range contraction/consolidation is now slowly morphing into retracement ( market has to digest the early Nov – end Jan rally somehow )
We may get a relief rally on 1st feb before further consolidation / pull back heading into February. In the coming days, we will be examining the highs and lows, supports and resistance to gauge the pullback /consolidation phases.
Quarterly refunding announcement ( QRA)
Everything was to the market expectation, but market still fall. Indices mired in the intraday downtrend before and after the QRA announcement,
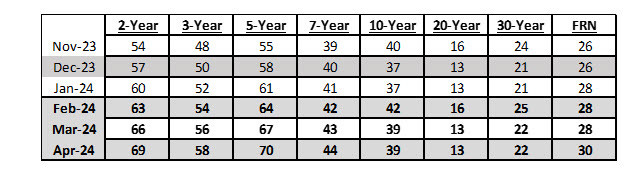
· 2 year $63b vs $63 billion expected
· 3-year $54b vs $53-$54 billion expected
· 5-year $64b vs $64 billion expected
· 7-year vs $40 billion expected
· 10-year $42b vs $42 billion expected
· 20-year $16b vs $16 billion expected
· 30-year $25b vs $25 billion expected
· Supply for next week $121b vs $121 billion expected
Given current fiscal forecasts, Treasury expects to maintain bill auction sizes at current levels into late-March.
Fed meeting and press conference
Rule out march hike possibilities. Media narratives say fed is dovish, but when I watch the press conference, Fed chair Powell sounds dovish enough for me. Either Fed is not meeting market extremely dovish expectations or I am not a good Fed analyst.
Anyway, we are in the business of staying on the right side of the market, if market deem it disappointing and rollover, we as a money manager shall follow accordingly.
Positioning Among big guys
In truth, the big institutions has been up to their eye balls in their Equity allocations since Oct 27 Reversal rally. Even if the price doesn’t rollover now, it will still rollover within the next 2 weeks, it’s question of WHEN ( not IF ) the price will rollover to initiate the pullback phases.
Post earning reactions
MSFT

Here’s a perfect teachable moment in MSFT intraday chart here, within the first 5 minutes, the price spike up 415 level, but was rejected subsequently and rather violently. ( this is a technical jargon call Liquidity spike removal for this phenomena, happen in 5, 15 minutes, 1,4 hour or even daily, weekly, market is fractal ). This type of opening looks suspiciously tempting to buy, almost as if market want to suck in as much FOMO trader as possible, only to spit them out in the next 1 hour or so. I have been a victim of this many times, not a fun thing to deal with.
So why is this happening ? Short answer, good news has all ben priced in, buying inflow has been exhausted. Not saying it will reverse from here, but we do have to go through some consolidation before it can get higher again in the future.
Just one more observation, if MSFT being the best of Mag 7 with significant Revenue & EPS beat & being the best at Integrating Generative AI in their software stack, is not able to rally further, it does make you wonder how would Apple, Meta & Amazon have any chance of rallying post earnings ?
S&P 500 11 sectors

Healthcare and Utilities are Best performing sector, while Technologies and Communications are at the bottom.
MOVE index

Move index is still stuck in the range
NYSE market internals

On Jan 31st 2024, 3.61 to 1 NYSE Decliner to Advancer ratio (2227/616 )
Bitcoin section
Bitcoin daily charts

Technically speaking, Fail breakout (upside breakout ) indicates professional selling pressure and is bearish near-term, the following is happening currently
20D MA cross below 50D MA and price is staying 50D MA, 43500 level and is at risk of falling further.
Will it morph into mid term down trend or will it be a retracement in longer term Uptrend, only time will tell.
Asian Market
Hang Seng
Recent action and news for China & Hong Kong stock market has been absolutely brutal ( a stark contrast to their neighbour, Japan stock market who has been on a tear )
And there was some washout as well ( Asia genesis shutting down after their losing bet on China and Japan ). So I am covering and examining the market to see if 14795 is the lasting bottom or a local low.
So let look at Hang Seng Index,

Hang Seng inability to go to higher than 16450 looks bearish near term.
The down trend line is getting steeper, and the index likely will fall further and , which could potentially evolve into a waterfall plunge phases. Not advisable to catch a falling knife, unless you want to end up having the same fate as Asia genesis.
The following sections are for subscribers
Level to watch out
Breadth chart
AVWAP chart
Cautious sign to lookout for
To read the rest of the sections, Kindly consider to become a paid subscriber to access the full market review report.
Paid Subscriber can get in-depth & actionable, Breadth, Sentiment, Flow & all other timely technical charts to optimize your trade & investment allocations positions from short , mid and long term perspective.
If you miss the paid subscription, you risk missing out on exclusive tips to boost your portfolio returns in favourable conditions (as well as protecting your portfolio in adverse conditions)